

How to visualize data
HERE Inspector
You can visualize data in Jupyter notebooks using the HERE Inspector package. The inspector allows you to visualize data from various sources, including the HERE platform. It provides an interface designed to support multiple backends.
Currently, the only supported backend is:
Note: The map widget used in this visualization is the default widget provided by the HERE map service. In order to use the widget, please ensure that you have set the environment variable "LS_API_KEY" with your HERE API key.
Capabilities include:
- Display interactive maps
- Set basemap
- Add layers
- Center and zoom
- Display interactive charts
- Simple programmatic interface
- Support for displaying heatmaps, choropleths, markers, clustering, and styling
- UI controls for interactive applications
Data formats supported:
- GeoJSON Features and FeatureCollections
- GeoPandas GeoSeries
- GeoPandas GeoDataFrame
- Shapely BaseGeometry objects
Basic visualization
The simplest usage of Inspector is to call its inspect function for immediate one-line visualization of georeferenced data within a Jupyter notebook.
Inspect single dataset
Note: To use a specific map widget, you will need to specify the appropriate inspector_class and api_key options. For example, to use the Ipyleaflet map widget, you would set options.inspector_class = IpyleafletInspector and options.api_key = None.
Ipyleaflet widget
import json
from here.inspector import inspect

# Dataset type = GeoJSON file
# This file contains polygon features describing neighborhood boundaries in Chicago
with open('sample_datasets/neighborhood_boundaries.geojson') as f:
    area_boundaries = json.load(f)

from here.inspector import options,IpyleafletInspector
options.inspector_class = IpyleafletInspector
options.api_key = None

inspect(area_boundaries)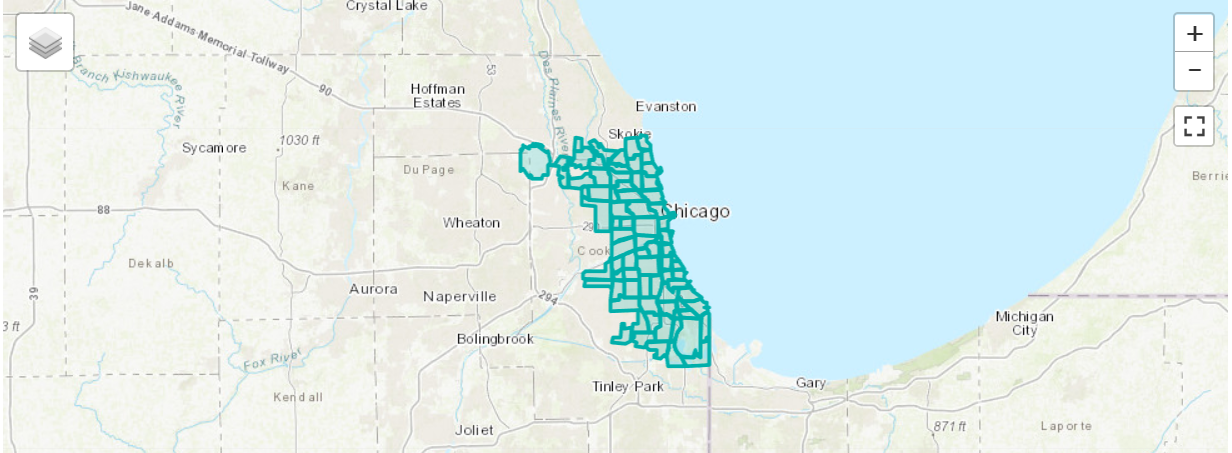
Inspect multiple datasets
import geopandas as gpd

# Dataset type = GeoDataFrame
# This dataframe contains all Chicago Transit Authority rail station entrance locations
cta_df = gpd.read_file('sample_datasets/cta_entrances.geojson')
cta_df.head()| name | agency | line | geometry | |
|---|---|---|---|---|
| 0 | 18th | CTA | Pink Line | POINT (-87.669144 41.857849) |
| 1 | 35th/Archer | CTA | Orange Line | POINT (-87.680632 41.829274) |
| 2 | 95th-Dan Ryan | CTA | Red Line | POINT (-87.62441 41.722729) |
| 3 | Adams/Wabash | CTA | Brown, Purple, Orange, Pink, Green Lines | POINT (-87.625997 41.879715) |
| 4 | Addison | CTA | Blue Line | POINT (-87.718406 41.946604) |
Ipyleaflet widget
from here.inspector import options,IpyleafletInspector
options.inspector_class = IpyleafletInspector
options.api_key = None

inspect(layers={'Neighborhoods': area_boundaries, 'Stations': cta_df})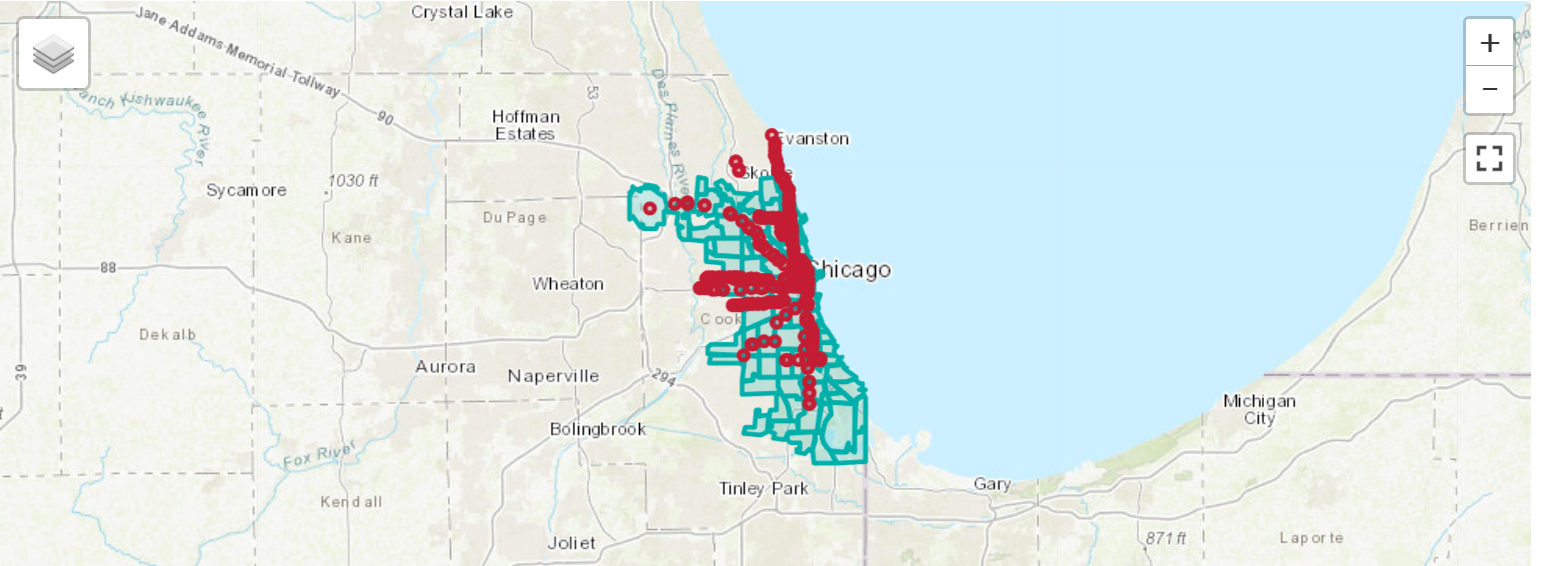
Advanced styling
The Inspect interface provides basic configuration options including:
- Setting map theme
- Choosing a basemap
- Setting display center point and zoom level
- Custom colors
Advanced styling capabilities are available for supported rendering backend ipyleaflet. The Inspector.backend function provides access to all advanced functionalities of the rendering backend, allowing unlimited customization.
Please see the Tutorial Notebook ExploreInspector_ipyleaflet.ipynb for comprehensive examples of all visualization options.
Updated 23 days ago