HERE DEMを使用して地形データを3Dで表示する
HERE数値標高モデル (DEM) は、色分けされた地形標高情報を含む詳細なデータセットを提供し、正確で魅力的な3D地図の作成が重要なユースケースにおいて不可欠な役割を果します。このチュートリアルでは、MapLibreライブラリを使用して、HEREからDEMデータをロードして処理し、地図検索と表示を行うプロセスについて説明します。MapLibreの機能とHERE DEMデータセットを組み合わせることで、複雑な地形の特徴を精密に示すインタラクティブな3D地図を作成できます。
前提条件
3D地図の標高データのソースであるdemスタイルを理解していること。詳細については、「スタイル」を参照してください。
マップコンテナを設定する
HERE DEMデータを使用して3D地図を作成するには、まずHTMLファイルに基本的なマップコンテナを設定します。
<!DOCTYPE html>
<html lang="en">
<head>
    <title>3D Terrain Map with HERE DEM</title>
    <meta charset='utf-8'>
    <meta name="viewport" content="width=device-width, initial-scale=1">

    <!-- MapLibre GL CSS for 3D map rendering -->
    <link rel='stylesheet' href='https://unpkg.com/[email protected]/dist/maplibre-gl.css' />

    <!-- MapLibre GL JS library -->
    <script src='https://unpkg.com/[email protected]/dist/maplibre-gl.js'></script>
    <style>

        /* Remove margins and padding to make the map full screen */
        body { margin: 0; padding: 0; }

        /* Ensure the map container takes up the full viewport */
        html, body, #map { height: 100%; }
    </style>
</head>
<body>

<!-- Map container -->
<div id="map"></div>

<!-- Your JS file with map initialization and configuration -->
<script src="demo.js"></script>
</body>
</html>
3D地図ベースを作成する
マップコンテナの設定が完了したので、JavaScriptファイル経由でMapLibreライブラリを使用してHERE DEMデータをロードし、レンダリングします。次のサンプルコードでは、ベースラスターレイヤー、陰影起伏レイヤー、DEMレイヤーの3つのレイヤーを組み合わせてベースマップを作成します。各レイヤーは表示品質を最大限に高めるために、個別にレンダリングされます。
// Instantiate your HERE API key
// Replace the placeholder value with a valid HERE API key
const apiKey = "YOUR_HERE_API_KEY"
const map = (window.map = new maplibregl.Map({
    container: 'map',
    zoom: 11,
    center: [10.8855,45.9122],
    // Set the initial pitch angle to give a tilted 3D view
    pitch: 45,
    // Enable hash-based navigation (adds coordinates and zoom to URL)
    hash: true,
    // Define the map style and data sources
    style: {
        version: 8,
        sources: {
            // HERE base raster tile source
            rasterTileApi: {
                type: 'raster',
                // This request template renders the map in the explore.day style
                tiles:
                      [`https://maps.hereapi.com/v3/base/mc/{z}/{x}/{y}/png?size=256&style=explore.day&apiKey=${apiKey}`],
                tileSize: 256,
                attribution: "© 2025 HERE",
                maxzoom: 14,
                minzoom:1
            },
            // HERE terrain data source for elevation and 3D effects
            terrainSource: {
                type: 'raster-dem',
                tiles:
                    [`https://maps.hereapi.com/v3/base/mc/{z}/{x}/{y}/png?size=256&style=dem&apiKey=${apiKey}`],
                tileSize: 256,
                attribution: "© 2025 HERE",
                maxzoom: 14,
                minzoom:1
            },
            // HERE hillshade data source to add shading effects
            hillshadeSource: {
                type: 'raster-dem',
                tiles:
                    [`https://maps.hereapi.com/v3/base/mc/{z}/{x}/{y}/png?size=256&style=dem&apiKey=${apiKey}`],
                tileSize: 256,
                attribution: "© 2025 HERE",
                maxzoom: 14,
                minzoom:1
            }
        },
        // Define the map layers
        layers: [
            {
                id: 'cartography',
                type: 'raster',
                source: 'rasterTileApi'
            },
            {
                id: 'hills',
                type: 'hillshade',
                source: 'hillshadeSource',
                layout: {visibility: 'visible'}
            }
        ],
        // Set terrain configuration to use the terrain source
        terrain: {
            source: 'terrainSource'
        },
        // Enable the sky layer for a natural sky effect
        sky: {}
    },
    // Set maximum zoom level to limit how close you can get
    maxZoom: 14,
    // Set the maximum pitch angle (tilt)
    maxPitch: 85
}));
// Add navigation controls (zoom and compass) to the map
map.addControl(
    new maplibregl.NavigationControl({
        visualizePitch: true,
        showZoom: true,
        showCompass: true
    })
);
// Add terrain control to allow toggling terrain on and off
map.addControl(
    new maplibregl.TerrainControl({
        source: 'terrainSource'
    })
);結果:
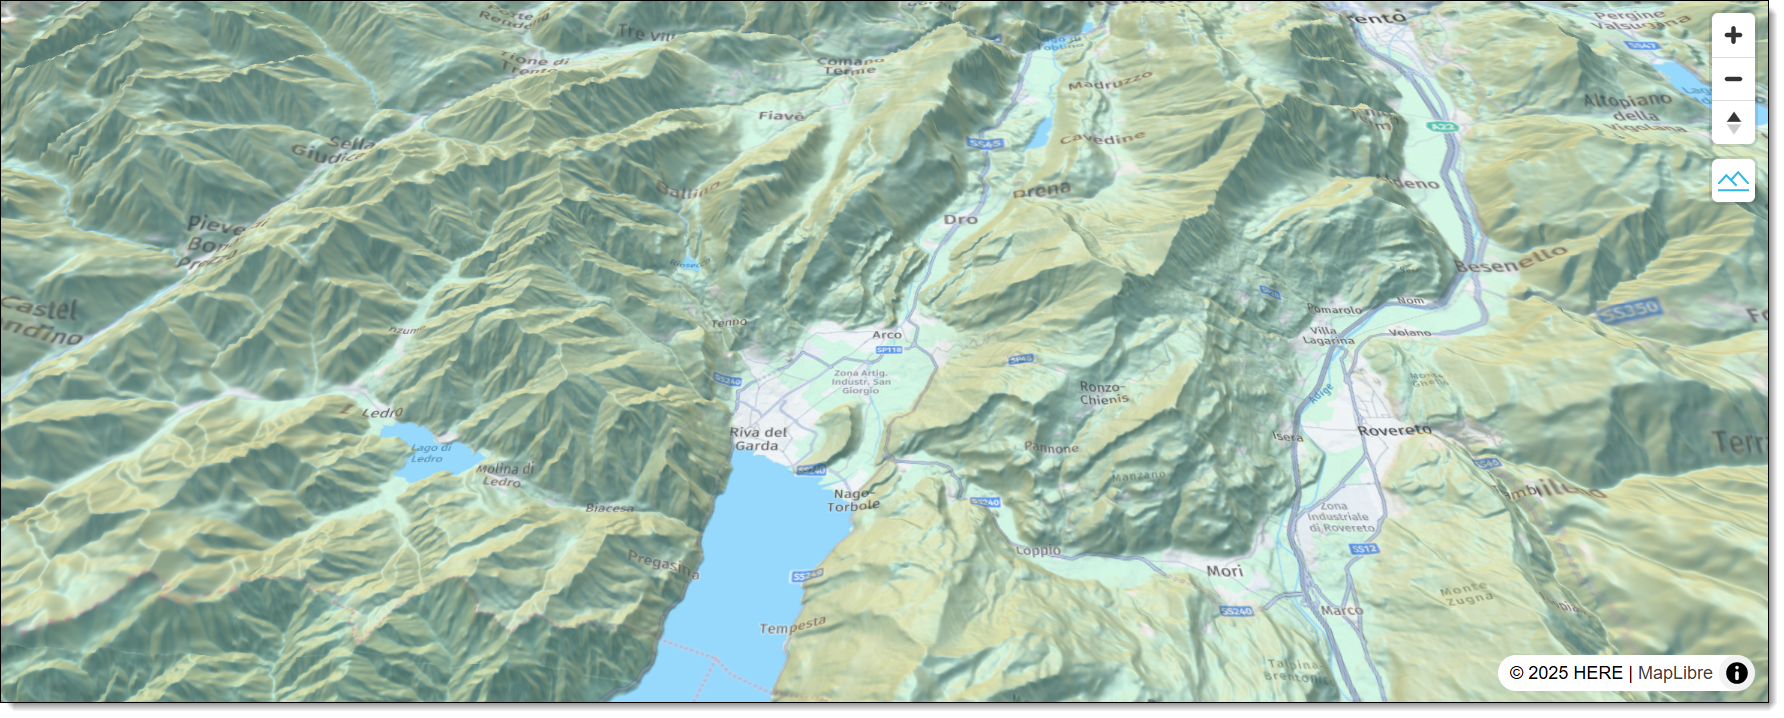
任意のブラウザーでHTMLファイルを開くと、ブラウザーウィンドウに次の3D地図が表示されます。
次のステップ
詳細については、「APIリファレンス」を参照してください。
3 か月前の更新
このページは役に立ちましたか?