Display interactive map layers
Note
The 3.1 version of this API has been deprecated. For continued support and feature development, upgrade to the latest 3.2 version.
Interactive Map Layer (IML) in the Maps API for JavaScript provide a way to integrate dynamic, real-time, or sensitive data into your mapping application. By using IML, you can efficiently manage and visualize large datasets with various style and filtering capabilities to suit your business use case.
For example, you can dynamically style and filter datasets with geospatial data, such as locations of public amenities, real-time traffic updates, or environmental data, making it easier for users to explore and interact with geospatial information.
IMLs are stored in the HERE platform, which provides a comprehensive and interactive experience for managing and analyzing geographic data by enabling you to perform a detailed inspection of features and layers, including viewing feature details, and understanding the data size and number of features within a layer. You can also view details on rendered data currently visible, or search for specific features by ID.
Tip
ALthough the following steps demonstrate how to render the IML in the read-only mode, you can also interact with your IML data by updating, adding, or removing records directly from your mapping application. For more information, see the HERE Data API Developer Guide.
Tutorial objectives
In this tutorial, you accomplish the following tasks:
- Create an Interactive Map Layer in the HERE platform, containing publicly available geospatial data about street markets in Amsterdam.
- Use the Maps API for JavaScript to connect to the layer and display the street market locations as markers on a vector map.
- Manipulate the IML data by creating a selector to display markets based on their type (
Food Consumption On-Site,Food Takeaway,Non-Food, and so on).
Prerequisites
- On the HERE platform, create a project and register app. For more information, see Get started.
- Obtain an OAuth 2.0 token to authenticate API requests, as described in further steps. For more information, see Access keys and OAuth tokens.
- Prepare the data to upload as part of an IML. This tutorial uses the publicly available GeoJSON data related to street markets in Amsterdam.
Create a catalog
Create a catalog that is a collection of related data layers. A catalog can contain different types of layers representing different types of stream or batch data, including geospatial data. Catalogs are identified by a unique HERE Resource Name (HRN), which the HERE platform generates automatically when you create a catalog.
You can create a catalog in the following ways:
- Through the HERE platform user interface, as the following steps describe.
- Through the HERE Data API call to the
configservice. For more information, see Create a catalog in the HERE Data API Developer Guide.
Follow these steps to create a catalog in the HERE platform user interface.
-
In the HERE platform, open the Launcher menu from the top navigation bar.
-
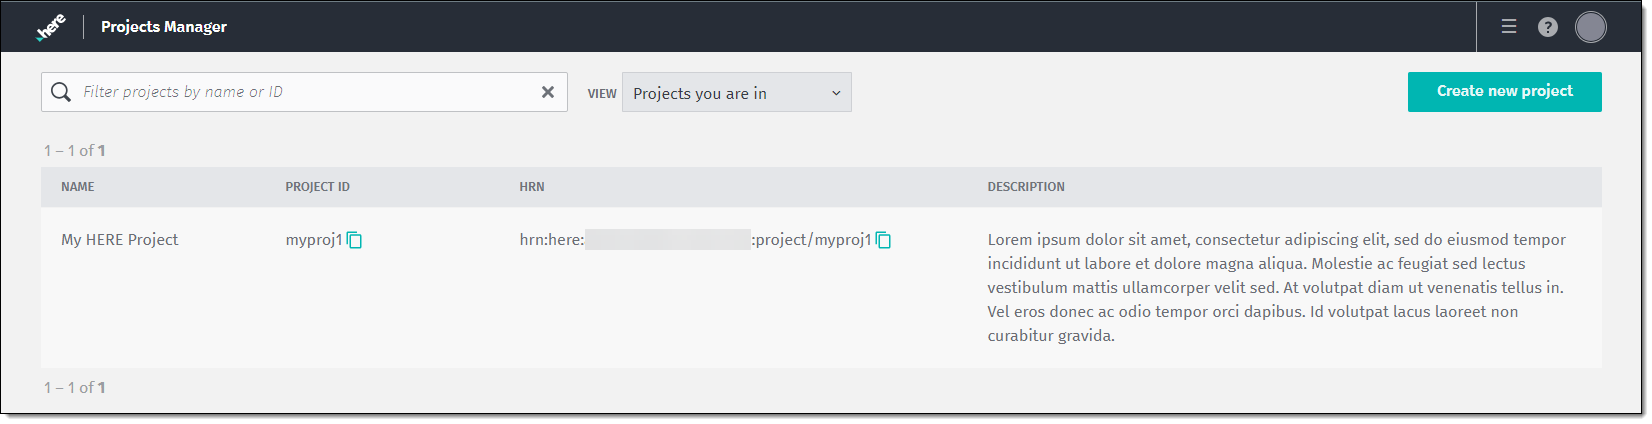
From the Launcher menu, select Projects Manager. The manager displays the list of your projects, as shown in the following example:
-
Select a project to host the catalog.
-
In the selected project, on the Resources tab, in the Catalogs section, click Add a catalog > Create a new catalog.
-
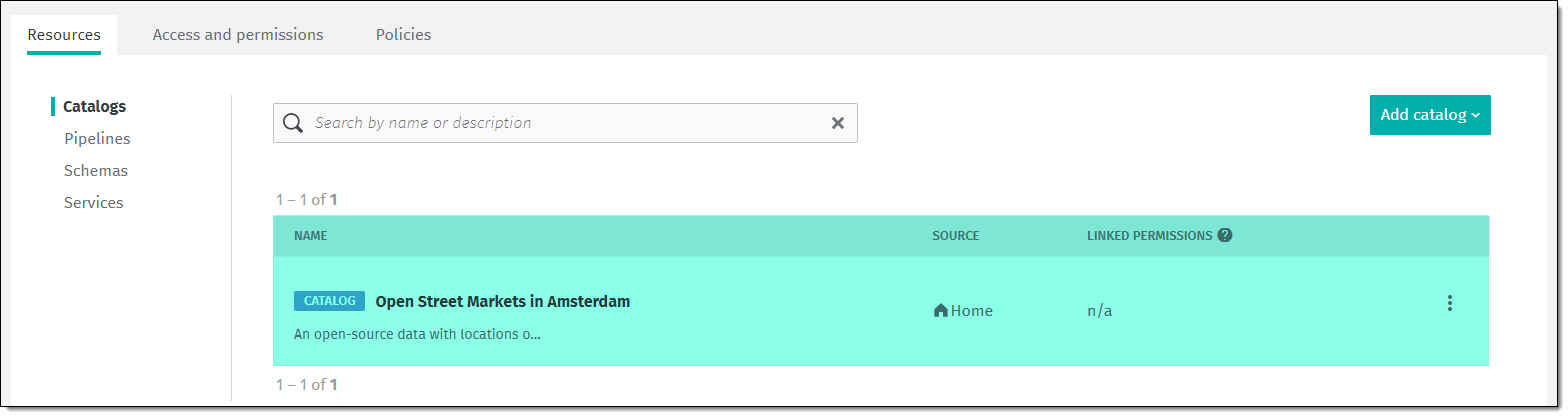
In the Add catalog dialog menu, enter and configure the new catalog details, and then click Save to confirm your settings. The HERE platform adds the catalog to the list of available resources in your project, as shown in the following example:
Note
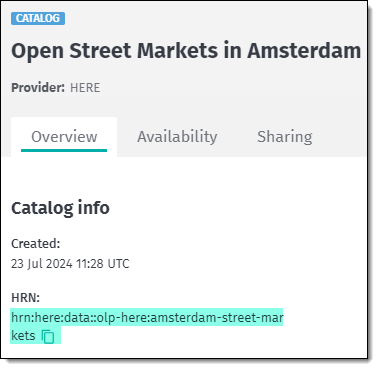
The HRN of the catalog is listed on the Overview tab, in the Catalog Info section:
-
Select the catalog that you just created.
-
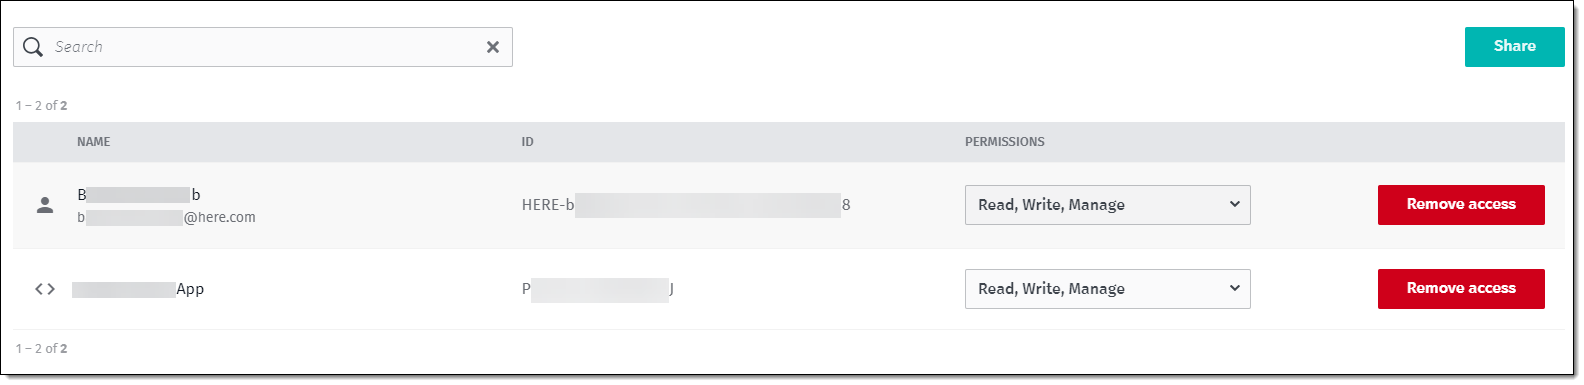
On the Sharing tab, ensure that both your user ID and your platform app have at minimum Read and Write permissions within the scope of the catalog. To grant Read, Write, or Manage permissions to an entity within the HERE platform, click Share. See the following figure for reference:
Create an Interactive Map Layer
Create an IML to host the data related to specific geographic entities and features.
-
In the catalog that you just configured, click Add new layer.
-
In the Configuration dialog menu for the new layer, in the Layer Type drop-down, select Interactive Map.
-
Configure the mandatory layer properties, such as Layer Name, Layer ID, Layer Summary, Layer Description, and Cost Allocation Tags.
Note
- Note down the Layer ID property value.
- In this tutorial, the sample layer uses the mandatory options only, as shown in the following figure for reference:
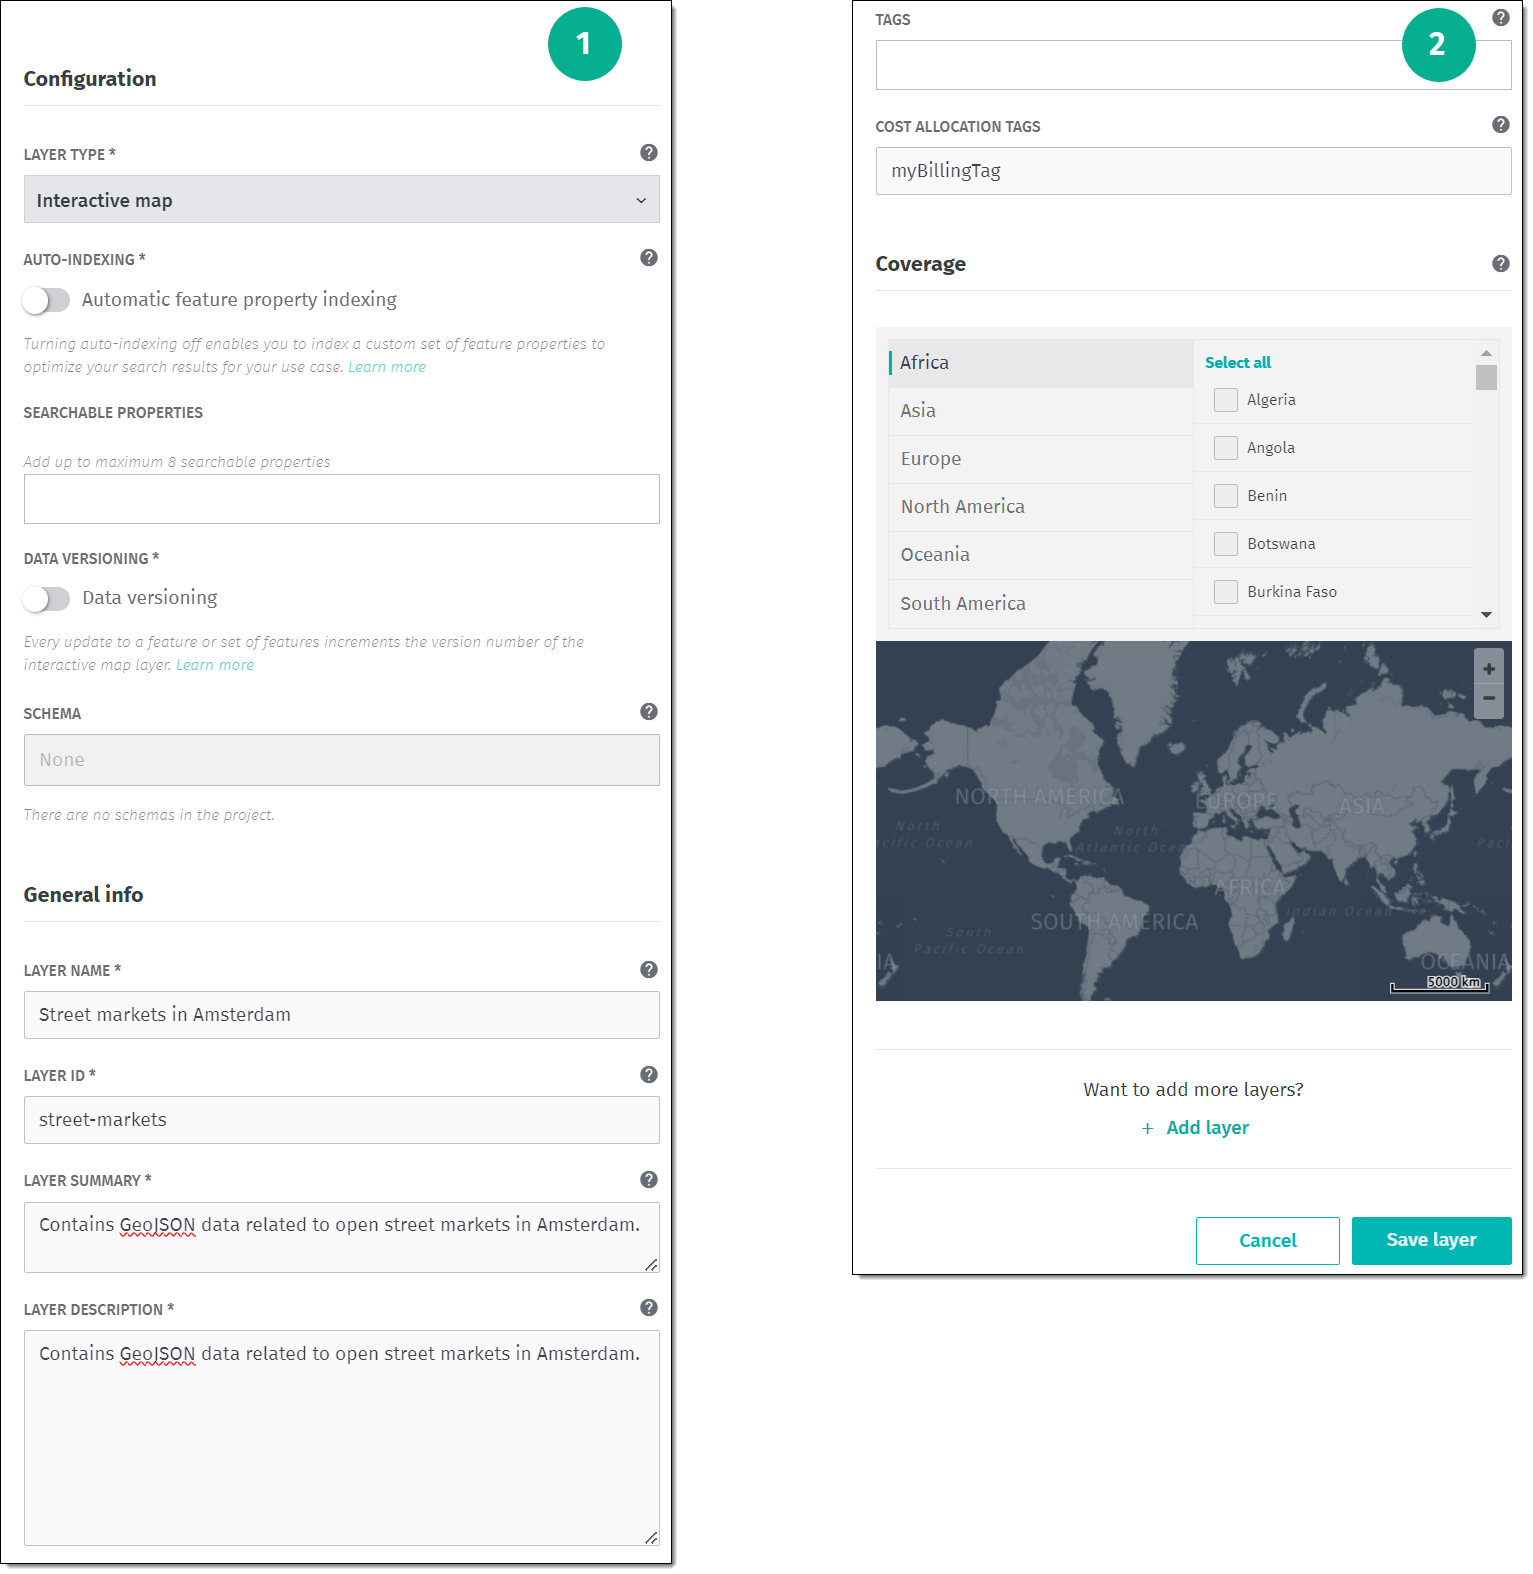
For more information about the mandatory and additional layer properties, see Create a layer in the Data API Developer Guide. 4. Confirm your settings by clicking Save layer.
Publish data to the layer
To publish your geospatial data to an IML, use the Interactive REST API. The following code snippet provides a sample curl request, adjusted for publishing data in the GeoJSON format:
curl -X PUT "https://interactive.data.api.platform.here.com/interactive/v1/catalogs/<CATALOG_HRN>/layers/<LAYER_ID>/features" \
     -H "Authorization: Bearer <TOKEN>" \
     -H "Accept: application/geo+json" \
     -H "Content-Type: application/geo+json" \
     -d '<GeoJSON>'
In that request:
<CATALOG_HRN>is the HERE Resource Number of the catalog that contains the layer to which you want to publish data, for example:hrn:here:data::olp-here:amsterdam-street-markets<LAYER_ID>refers to the ID of the target layer within that catalog, for example,street-markets.<TOKEN>is the authorization token required to authenticate the request.<GeoJSON>refers to the actual data to be sent with the request. This should be a GeoJSON-formatted string containing the features you want to insert.
For more information, see Publish data to an interactive map layer in the Data API Developer Guide.
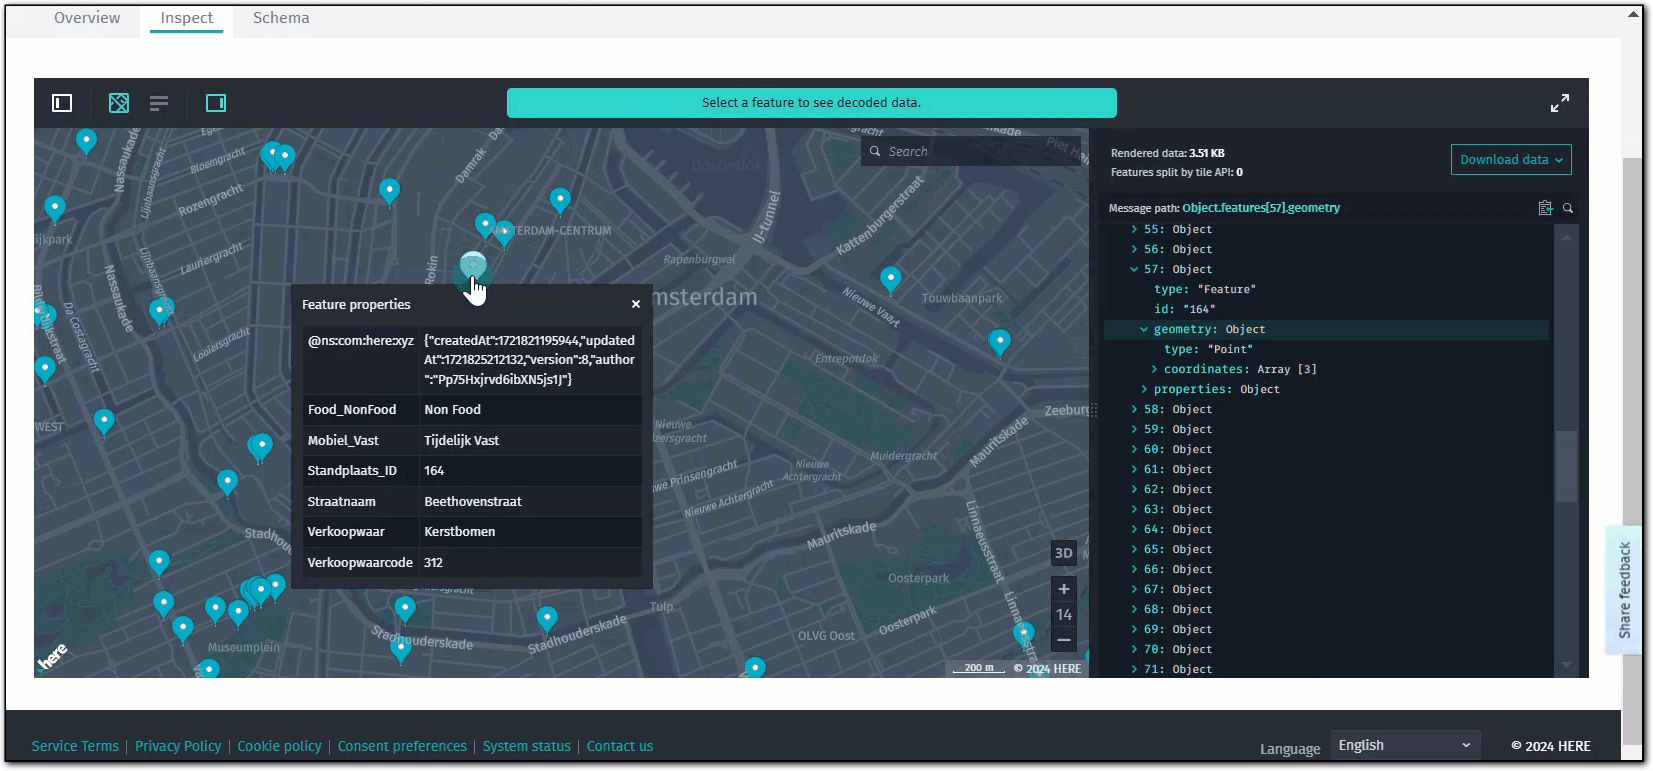
After you receive a 200 OK response from the server, you can inspect the layer data directly on the HERE platform, as shown in the following figure:
Display IML data on a map
After you create and populate an IML with data, you can use the Maps API for JavaScript to display this data on a map by using the IML Provider service. The service fetches the layer data through the HERE Interactive Map Data API, allowing you to interact with and manage custom layers on the map.
Create a base map
- Create a HTML file as the map container, and then ensure that you import the following libraries through the
<head>element:<script type="text/javascript" src="https://js.api.here.com/v3/3.1/mapsjs-core.js"></script> <script type="text/javascript" src="https://js.api.here.com/v3/3.1/mapsjs-service.js"></script> <script type="text/javascript" src="https://js.api.here.com/v3/3.1/mapsjs-mapevents.js"></script> - Within the HTML
<head>element, add the<style>tag with a CSS style definition your map container. For example, you can use the following basic style that sets the map viewport to100%height and width of the enclosing container:body { width: 100%; height: 100%; position: absolute; margin: 0px; padding: 0px; overflow: hidden; } #map { position:absolute; top:0; bottom:0; width:100%; height: 100%; } - Within the
<script>object of your HTML file, create a basic vector map by using thecreateDefaultLayersmethod, as shown in the following example:When opened in a browser window, the HTML file displays a HERE vector map with basic panning and zooming functionality.// Step 1: Obtain the platform object const platform = new H.service.Platform({ apikey: 'YOUR_HERE_API_KEY' }); // Step 2: Initialize a set of default map layers const defaultLayers = platform.createDefaultLayers(); // Step 3: Instantiate the map by using the createDefaultLayers method const map = new H.Map( document.getElementById('mapContainer'), defaultLayers.vector.normal.map, { // Coordinates for Amsterdam, The Netherlands: center: { lat: 52.3676, lng: 4.9005 }, zoom: 15 } ); // Step 4: Initialize an instance of the MapEvents class, which is responsible for handling mouse and tap events on the map: const behavior = new H.mapevents.Behavior(new H.mapevents.MapEvents(map));
Render the IML layer
After initializing the mouse and tap events on the map, add the following function to import and display the IML data on the map:
function addIml(map) {
// Define Here Resource Name (HRN) of the catalog
const catalogHrn = "hrn:here:data::olp-here:amsterdam-street-markets";
// Define the layer that stores data
const layerId = "street-markets";
// Instantiate the IML service
const service = platform.getIMLService();
// Create a provider for the IML data
const imlProvider = new H.service.iml.Provider(service, catalogHrn, layerId);
// Add the IML layer to the map
map.addLayer(new H.map.layer.TileLayer(imlProvider));
}
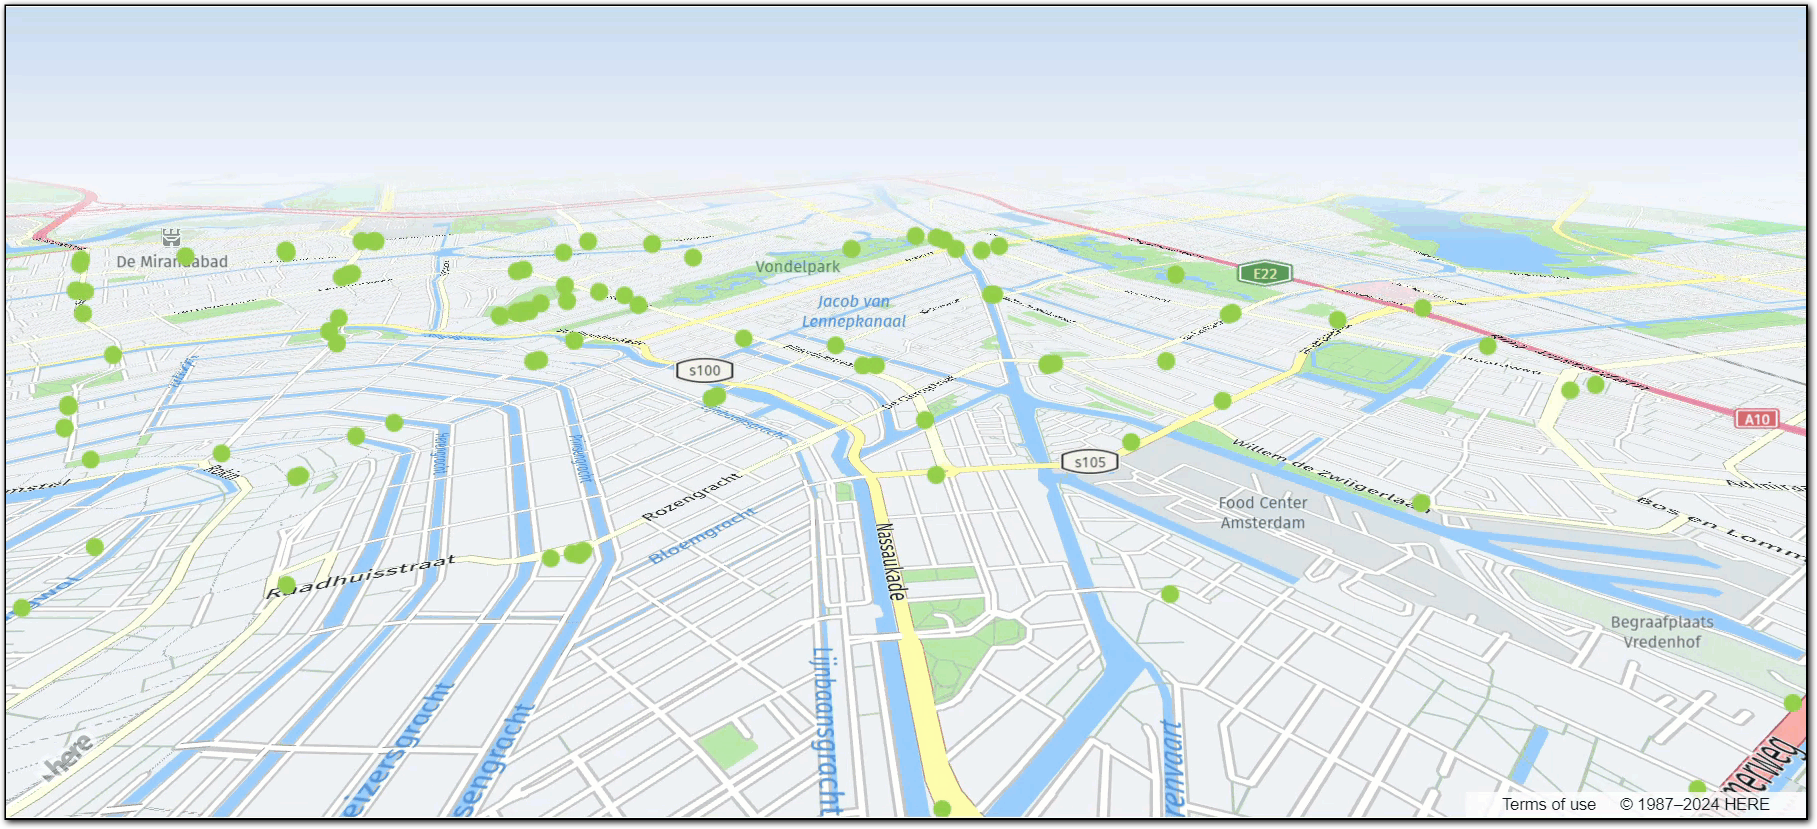
// Call the addIml(map) function to add the IML layer to the map:
addIml(map);The map now displays the geospatial data, with the locations of street markets in Amsterdam marked as points with the default styling, as shown in the following example:
Optional: Interact with the IML data
Further enhance the map by customizing the IML layer to display street market data with various styles based on the type of market. First, add a drop-down menu to enable users to filter the displayed data dynamically. Then, update the IML data styling on the map according to the selected market type. This ensures that only the markets of the chosen type are displayed, allowing users to easily differentiate between different market types.
To start, identify the property from the data you uploaded to the IML layer that will be used to filter different types of markets on the map. Here is a sample object from that layer, in the GeoJSON format, representing a single market:
{
  "id": 198,
  "type": "Feature",
  "geometry": {
    "type": "Point",
    "coordinates": [
      4.8837643,
      52.3742953
    ]
  },
  "properties": {
    "Standplaats_ID": 198,
    "Straatnaam": "Westermarkt",
    "Verkoopwaar": "Hotdogs",
    "Mobiel_Vast": "Vast",
    "Food_NonFood": "Food Consumptie",
    "Verkoopwaarcode": 202
  }
}
In the previous example, the properties object contains key-value pairs that provide additional details about each market. The Food_NonFood property specifies the market type and can be used for filtering different market types on the map. It has the following values:
"Non Food"(Non-Food)"Food Consumptie"(Food Consumption On-Site)"Food Meenemen"(Food Takeaway)"Onbekend"(Unknown)
Add a drop-down menu
In the HTML file, add a <select> button with the available filtering options by placing the following code in the <body> object of your HTML file:
<label for="marketType">Select Market Type:</label>
  <select id="marketType" style="margin: 10px;">
    <option value="all">All</option>
    <option value="non_food">Non-Food</option>
    <option value="food_consumptie">Food Consumption On-Site</option>
    <option value="food_meenemen">Food Takeaway</option>
    <option value="onbekend">Unknown</option>
  </select>
Adjust the IML layer style for each market type
Adjust the addIml function to customize the appearance of different market types based on predefined styles. An event listener on a dropdown menu dynamically filters the displayed market data by adjusting the visibility of market types on the map based on user selection.
The following snippet shows the updated addIml function that now provides style customizations of the IML layer:
function addIml(map) {
  // Define Here Resource Name (HRN) of the catalog
  const catalogHrn = "hrn:here:data::olp-here:amsterdam-street-markets";
  // Define the layer within the catalog that stores the data
  const layerId = "street-markets";
  // Instantiate the IML service from the HERE platform
  const service = platform.getIMLService();
  // Create a provider for the custom user-defined data
  const imlProvider = new H.service.iml.Provider(service, catalogHrn, layerId);

  // --- IML STYLE CUSTOMIZATION STARTS HERE ---
  // Retrieve the current style configuration for the IML provider
  const imlCustomStyleConfig = imlProvider.getStyle().getConfig();

  // Define custom styles for different data types based on their properties
  imlCustomStyleConfig.layers.iml.points = {
    filter: {
      $geometry: 'point'
    },
    draw: {
      points: {
        collide: false
      }
    },
    non_food: {
      filter: {
        "properties.Food_NonFood": "Non Food"
      },
      draw: {
        points: {
          visible: true,
          color: '#00FF00',
          size: '10px'
        }
      },
    },
    food_consumptie: {
      filter: {
        "properties.Food_NonFood": "Food Consumptie"
      },
      draw: {
        points: {
          visible: true,
          color: '#0000FF',
          size: '10px'
        }
      },
    },
    onbekend: {
      filter: {
        "properties.Food_NonFood": "Onbekend"
      },
      draw: {
        points: {
          visible: true,
          color: '#FF0000',
          size: '10px'
        },
        text: {
          text_source: "properties.Straatnaam",
          visible: true,
          priority: 0,
          offset: [0, -15],
          font: {
            size: '10px',
            fill: 'blue',
            stroke: {
              color: 'white',
              width: '2px'
            }
          }
        }
      },
    },
    food_meenemen: {
      filter: {
        "properties.Food_NonFood": "Food Meenemen"
      },
      draw: {
        points: {
          visible: true,
          color: '#FFFF00',
          size: '10px'
        }
      }
    }
  };

  // Apply the custom style configuration to the IML provider
  imlProvider.getStyle().setConfig(imlCustomStyleConfig);
  // Create the IML tile layer using the configured IML provider
  const imlLayer = new H.map.layer.TileLayer(imlProvider);
  // Add the IML tile layer to the map
  map.addLayer(imlLayer);
}

// Get the dropdown element by its ID
const select = document.getElementById('marketType');
// Add an event listener to handle changes in the dropdown selection
select.addEventListener('change', (e) => {
  // Define bitmask values for different market types
  const mask = {
    'all': 0b1111,
    'non_food': 0b1000,
    'food_consumptie': 0b0100,
    'onbekend': 0b0010,
    'food_meenemen': 0b0001,
  };
  // Get the selected type from the dropdown
  const selectedType = e.target.value;
  // Get the IML layer from the map's layers array
  const imlLayer = map.getLayers().asArray()[1];
  // Get the current style of the IML layer
  const style = imlLayer.getProvider().getStyle();

  // Update the visibility of each market type based on the selected type
  style.setProperty('layers.iml.points.non_food.draw.points.visible', Boolean(mask[selectedType] & mask['non_food']));
  style.setProperty('layers.iml.points.food_consumptie.draw.points.visible', Boolean(mask[selectedType] & mask['food_consumptie']));
  style.setProperty('layers.iml.points.onbekend.draw.points.visible', Boolean(mask[selectedType] & mask['onbekend']));
  style.setProperty('layers.iml.points.onbekend.draw.text.visible', Boolean(mask[selectedType] & mask['onbekend']))
  style.setProperty('layers.iml.points.food_meenemen.draw.points.visible', Boolean(mask[selectedType] & mask['food_meenemen']));
});
The code from the previous example, performs the following functions:
-
Retrieves the current style configuration from the IML provider. This configuration determines how the data is visually represented on the map.
-
Defines custom styles for different market types, such as
non_food,food_consumptie,onbekend, andfood_meenemen. Each style includes visual properties likecolorandsize, and a filter condition that specifies which market data should use this style.Note
In addition to geometry data, you can use the IML layer to display textual data on the map. For example, the style properties for the
Unknown("Onbekend") market type enable the display of the market name in addition to the correspondingpointgeometry. -
Set the custom style to the IML provider.
-
Adds an event listener to the drop-down menu to allow the user to select a market type to display.
-
Manages the visibility of different market types by using bitmasks.
-
Adjusts the visibility of points for each market type by modifying the style properties of the IML layer, based on the selected filter.
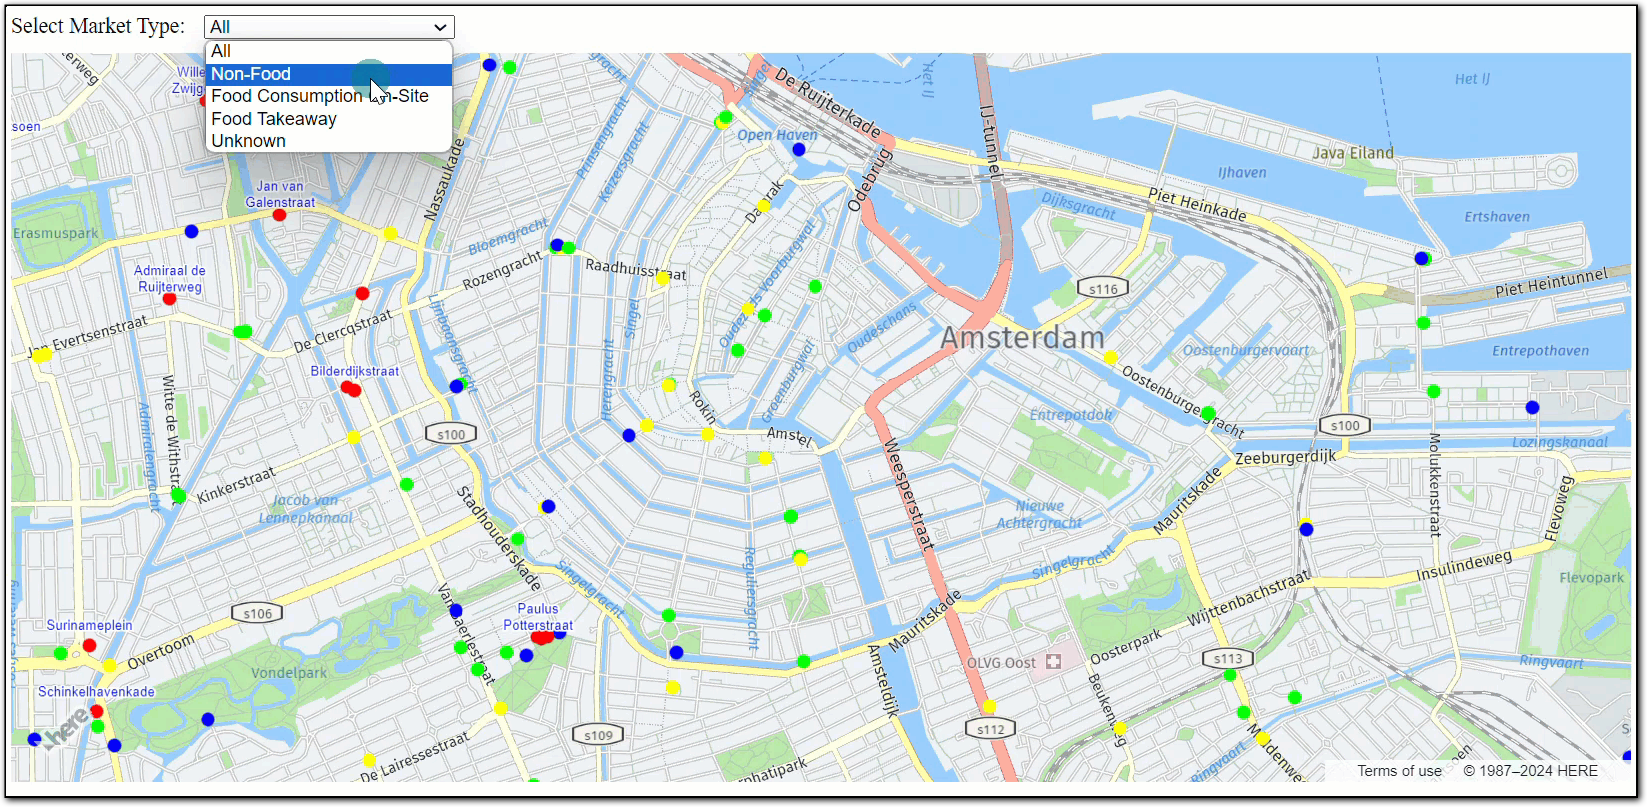
The following figure illustrates the updates made to the IML styles. It also shows how users can filter different market types:
Summary
In this tutorial, you created and configured an Interactive Map Layer in the HERE platform. You populated the layer with data through the Interactive REST API call. Then, by using the ID of the layer and the HRN of its parent catalog, you displayed the IML data on a HERE map through the Maps API for JavaScript. Finally, you interacted with the layer data by defining different style for IML data objects based on their properties to further enhance the user experience.
Next steps
To further explore the design and features of the Maps API for JavaScript, see the API Reference.