Practical examples and applications
Note
The 3.1 version of this API has been deprecated. For continued support and feature development, upgrade to the latest 3.2 version.\
Base map style customization is done with HERE Style Editor.
Customizing the visual appearance of map elements through vector data styling is a fundamental technique for creating maps that match your application's look and feel. This process provides fine-grained control over aspects like colors, line thickness, labels, and icons for geographic features such as roads, buildings, and points of interest.
Apply custom map styles
As a starting point, the Maps API for JavaScript provides a number of default styles for vector maps as part of the Platform.createDefaultLayers() method. These styles come out-of-the-box with the API and offer a consistent and familiar look and feel for common mapping scenarios.
Map styling rules follow the general pattern defined by the open source Tangram rendering engine which specifies configurations in YAML format.
The following example defines how to render a water layer provided by the HERE Vector Tile API. For more information about layers available within the Vector Tile API, refer to the Layers section in the REST API documentation.
sources:
omv:
type: OMV
# global description of the map, in this example
# the map background color is white
scene:
background:
color: [1.000, 1.000, 1.000, 1.00]
# section contains the style information for the layers
# that are present on the map
layers:
# user defined name of the rendering layer
water_areas:
# the section defines where the rendering layer takes
# its data from source: omv is mandatory for the Vector Tile API
# layer: water specifies what vector layer is taken
# for the rendering see REST API documentation for the
# list of available layers.
data: {source: omv, layer: water}
# section defines how to render the layer
draw:
polygons:
order: 1 # z-order of the layer
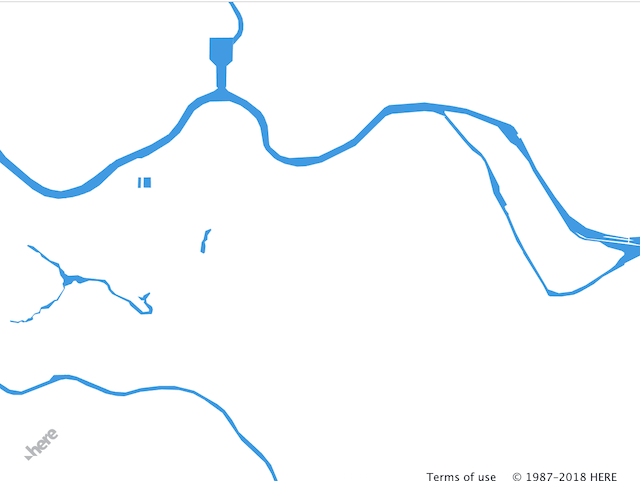
color: [0.055, 0.604, 0.914, 1.00]The preceding style defines the map background color. The style named water_areas defines how to render the data from the vector tile's water layer. You can set the style on the existing Maps API for JavaScript OMV layer as follows:
var style = `
sources:
    omv:
        type: OMV
# global description of the map, in this example
# the map background color is white
scene:
    background:
        color: [1.000, 1.000, 1.000, 1.00]

# section contains the style information for the layers
# that are present on the map
layers:
    # user defined name of the rendering layer
    water_areas:
        # the section defines where the rendering layer takes
        # its data from source: omv is mandatory for the Vector Tile API
        # layer: water specifies what vector layer is taken
        # for the rendering see REST API documentation for the
        # list of available layers.
        data: {source: omv, layer: water}
        # section defines how to render the layer
        draw:
            polygons:
                order: 1 # z-order of the layer
                color: [0.055, 0.604, 0.914, 1.00]
`;

// provided that map was instantiated with the vector layer
// as a base layer
var baseLayer = map.getBaseLayer();
baseLayer.getProvider().setStyle(new H.map.Style(style));
The following image shows the result:
For more information and use case examples, see Custom map styles.
Apply default styles
In the preceding section, the polygon style renders waterways. The Maps API for JavaScript provides the following styles for rendering lines, polygons, points, and text:
points-Pointgeometry, for example, road shields, POI icons, and so on.lines-Linegeometry, for example, road networks, railroads, ferries, and so on.polygons-Polygongeometry that covers a specific geographical area, for example, landuse, waterways, or building footprints.text- Text for the geometry, for example, road labels, building numbers, city names, and so on.
Building on the preceding example, you can add a simple road network representation to the style. In the following example, the lines style replaces polygons from the previous example to render road networks:
sources:
omv:
type: OMV
# global description of the map, in this example
# the map background color is white
scene:
background:
color: [1.000, 1.000, 1.000, 1.00]
# section contains the style information for the layers
# that are present on the map
layers:
# user defined name of the rendering layer
water_areas:
# the section defines where the rendering layer takes
# its data from source: omv is mandatory for the Vector Tile API
# layer: water specifies what vector layer is taken
# for the rendering see REST API documentation for the
# list of available layers.
data: {source: omv, layer: water}
# section defines how to render the layer
draw:
polygons:
order: 1 # z-order of the layer
color: [0.055, 0.604, 0.914, 1.00]
road:
data: {source: omv, layer: roads}
draw:
lines:
order: 2
color: [0.561, 0.561, 0.561, 1.00]
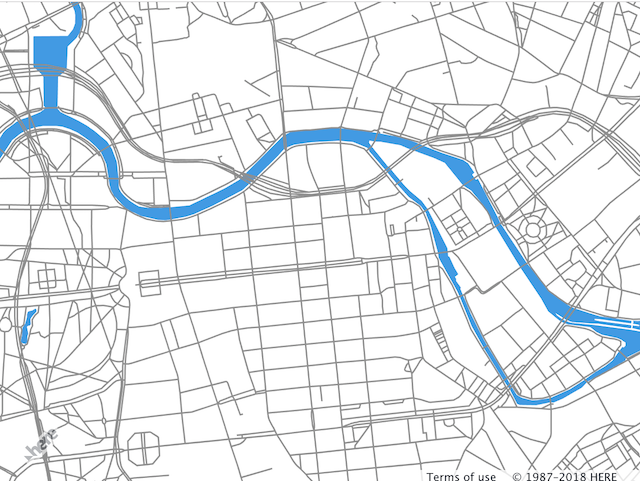
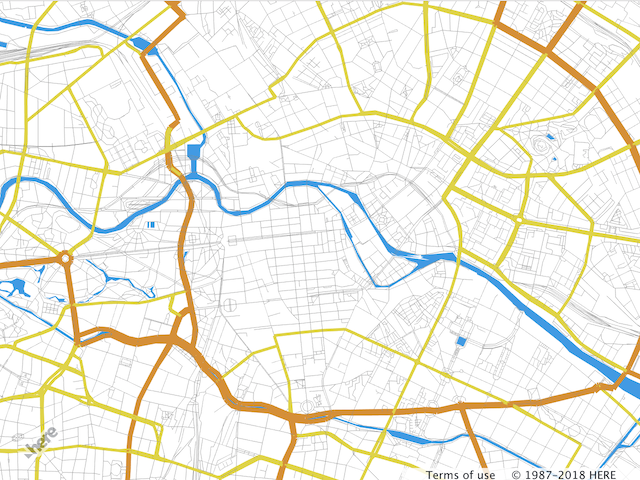
width: 15In the preceding example, there's a new section called roads. This section uses the roads vector tile data layer specifying the line color and width. If you replace the style template literal in the JavaScript preceding snippet, the code produces the following result:
Note
The color can be defined in the following formats:
CSS named colors
[r, g, b, a] - array that contains RGBA values in the range 0...1
'#RRGGBB' - RGB hex string
rgb(R, G, B) - CSS rgb color in the range 0...255 or 0%...100%
rgba(R, G, B, A) - CSS rgb color in the range 0...255 and alpha channel in the range 0...1
For more information and use case examples, see Default map styles.
Apply various styles to a single layer type
Depending on the geometries and attributes that the data source provides, you can use the styles interchangeably. For more information about available layers and their attributes, refer to the HERE Vector Tile API documentation.
The following examples illustrate how you can apply different styles to the same data layer. The following configurations below the water layer to render the encoded data with four different styles. These universal styles are applicable and exist for all data layers and properties. Find the description of each style and associated style attributes in the corresponding section.
The following code uses the polygon style to render blue water polygons.
sources:
    omv:
        type: OMV
layers:
    water_areas:
        data: {source: omv, layer: water}
        draw:
            polygons:
                order: 1
                color: [0.055, 0.604, 0.914, 1.00]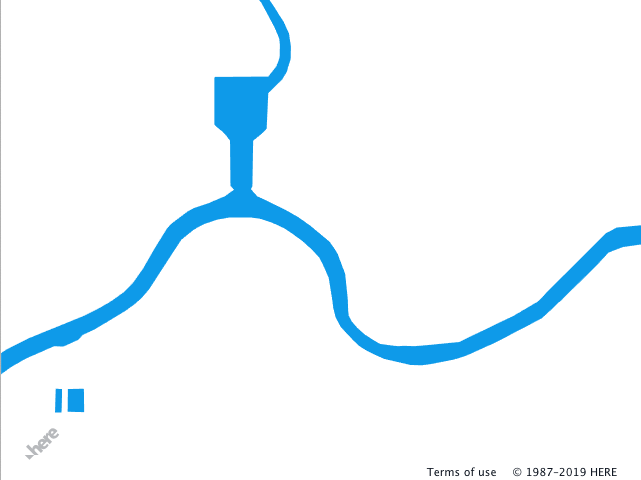
Changing the polygons style to lines allows you to render the outlines of the data encoded in the data layer.
sources:
    omv:
        type: OMV
layers:
    water_areas:
        data: {source: omv, layer: water}
        draw:
            lines:
                order: 1
                width: 2px
                color: [0.055, 0.604, 0.914, 1.00]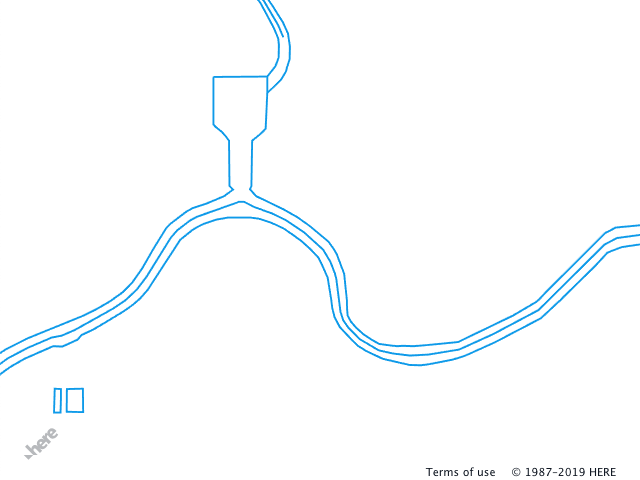
You can also apply the points style to the same data that renders points in place of the geometry vertices. The style defines the size and color of each point. To see all vertices, set the collide property of the style to false.
sources:
    omv:
        type: OMV
layers:
    water_areas:
        data: {source: omv, layer: water}
        draw:
            points:
                collide: false
                size: 6px
                color: [0.055, 0.604, 0.914, 1.00]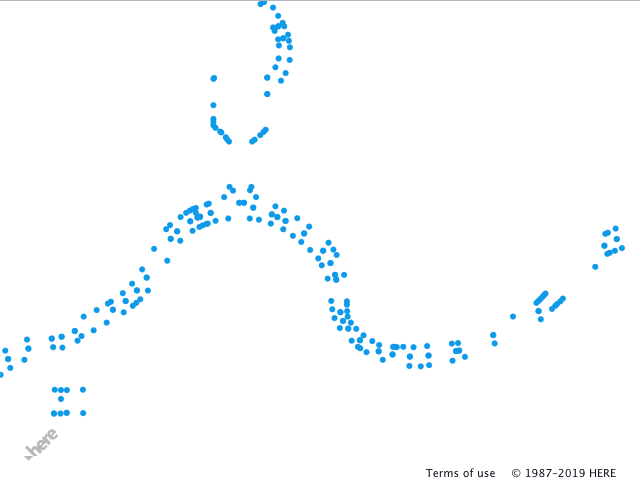
If the data layer provides properties that can have a textual representation, you can also apply the text style to the layer. In the following example, the water data layer includes the name property, which represents the name of the water feature. When defining the text style, you have the flexibility to choose any property for rendering.
sources:
    omv:
        type: OMV
layers:
    water_areas:
        data: {source: omv, layer: water}
        draw:
            text:
                collide: false
                font:
                    fill: rgba(0, 0, 20, 1.0)
                    size: 22px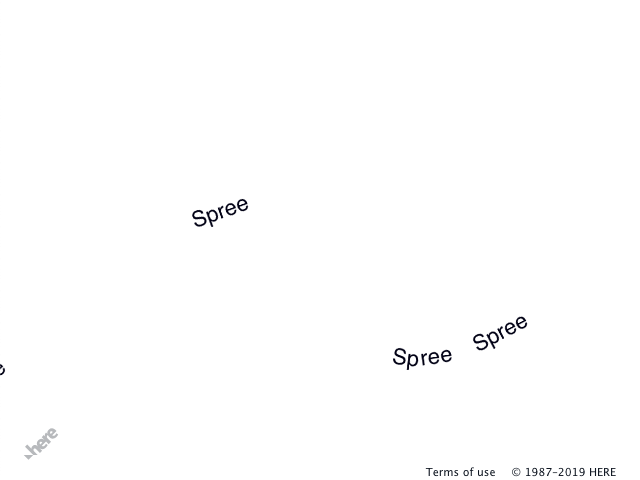
You can apply several styles to the same data layer within the logical layer. In the following example, polygons and text styles render the label information for the water polygons.
sources:
    omv:
        type: OMV
layers:
    water_areas:
        data: {source: omv, layer: water}
        draw:
            polygons:
                order: 1
                color: [0.055, 0.604, 0.914, 0.50]
            text:
                collide: false
                text_source: function() {return feature.name}
                font:
                    fill: rgba(0, 0, 20, 1.0)
                    size: 22px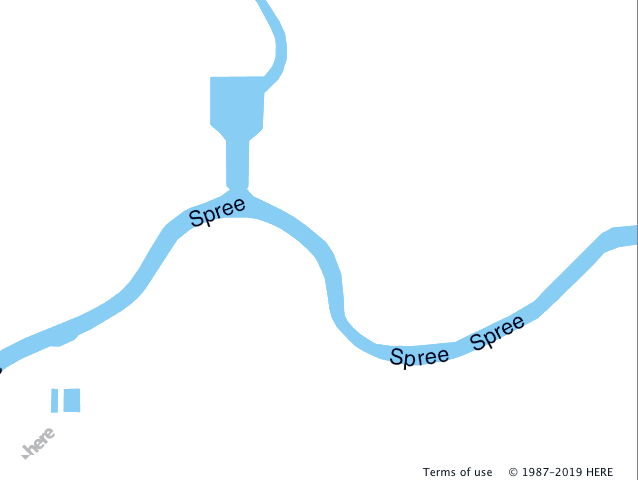
Filter out map features
You can filter map features based on the properties associated with them. In the previous section, the road network is gray, making the map difficult to read. Roads have different weights in the road network and style attributes in the vector tile. For the list of available properties, see the HERE Vector Tile API documentation. In the following snippet, there's a new major_road subsection in the road section. This subsection uses the filter attribute to narrow down map features.
sources:
    omv:
        type: OMV
# global description of the map, in this example
# the map background color is white
scene:
    background:
        color: [1.000, 1.000, 1.000, 1.00]

# section contains the style information for the layers
# that are present on the map
layers:
    # user defined name of the rendering layer
    water_areas:
        # the section defines where the rendering layer takes
        # its data from source: omv is mandatory for the Vector Tile API
        # layer: water specifies what vector layer is taken
        # for the rendering see REST API documentation for the
        # list of available layers.
        data: {source: omv, layer: water}
        # section defines how to render the layer
        draw:
            polygons:
                order: 1 # z-order of the layer
                color: [0.055, 0.604, 0.914, 1.00]
    road:
        data: {source: omv, layer: roads}
        draw:
            lines:
                order: 2
                color: [0.561, 0.561, 0.561, 1.00]
                # the width is set in the world meters
                width: 15
        major_road:
            # the filter section narrows down to what features of the
            # data layer the style must be applied to
            filter:
                kind: 'major_road'
            draw:
                lines:
                    color: [0.882, 0.553, 0.086, 1.00]
                    # the width is set in the screen pixels
                    width: 5px
As a result of the configuration from the preceding example, the API renders major roads on the map with line colors and widths distinct from the rest of the road network.
Note
You can define the line width can in either screen pixels or meters. When defined in screen pixels, the line width remains the same for all zoom levels.
You can add specific rules to the filter to get fine map presentation control. When you use several properties in the filter, the API combines them by using the logical AND operator. In the following example, there's a new section called major_road_tertiary. In this section, roads for which the kind_detail attribute is tertiary have a style with distinct width color. The original major_road filter was also changed and narrowed down to secondary.
sources:
omv:
type: OMV
# global description of the map, in this example
# the map background color is white
scene:
background:
color: [1.000, 1.000, 1.000, 1.00]
# section contains the style information for the layers
# that are present on the map
layers:
# user defined name of the rendering layer
water_areas:
# the section defines where the rendering layer takes
# its data from source: omv is mandatory for the Vector Tile API
# layer: water specifies what vector layer is taken
# for the rendering see REST API documentation for the
# list of available layers.
data: {source: omv, layer: water}
# section defines how to render the layer
draw:
polygons:
order: 1 # z-order of the layer
color: [0.055, 0.604, 0.914, 1.00]
road:
data: {source: omv, layer: roads}
draw:
lines:
order: 2
color: [0.561, 0.561, 0.561, 1.00]
# the width is set in the world meters
width: 15
major_road:
# the filter section narrows down to what features of the
# data layer the style must be applied to
filter:
kind: 'major_road'
kind_detail: 'primary'
draw:
lines:
color: [0.882, 0.553, 0.086, 1.00]
# the width is set in the screen pixels
width: 5px
tunnel:
# the filter adds more specific rules to the
# tunnel rendering
filter:
is_tunnel: true
draw:
lines:
color: [0.192, 0.882, 0.086, 1.00]
major_road_tertiary:
filter:
kind: 'major_road'
kind_detail: 'tertiary'
draw:
lines:
color: [0.882, 0.835, 0.086, 1.00]
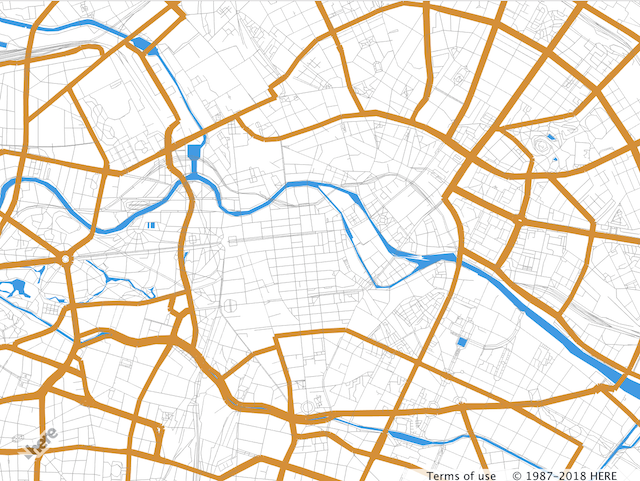
width: 3pxThe resulting map has three different road types rendered: gray as a default color, brown for the secondary roads, and yellow for the tertiary roads.
You can also change styles by using nesting. The following snippet adds specific rules for tunnel rendering on secondary roads.
Note
If you nest a style, that style inherits all properties from the parent style.
sources:
omv:
type: OMV
# global description of the map, in this example
# the map background color is white
scene:
background:
color: [1.000, 1.000, 1.000, 1.00]
# section contains the style information for the layers
# that are present on the map
layers:
# user defined name of the rendering layer
water_areas:
# the section defines where the rendering layer takes
# its data from source: omv is mandatory for the Vector Tile API
# layer: water specifies what vector layer is taken
# for the rendering see REST API documentation for the
# list of available layers.
data: {source: omv, layer: water}
# section defines how to render the layer
draw:
polygons:
order: 1 # z-order of the layer
color: [0.055, 0.604, 0.914, 1.00]
road:
data: {source: omv, layer: roads}
draw:
lines:
order: 2
color: [0.561, 0.561, 0.561, 1.00]
# the width is set in the world meters
width: 15
major_road:
# the filter section narrows down to what features of the
# data layer the style must be applied to
filter:
kind: 'major_road'
kind_detail: 'primary'
draw:
lines:
color: [0.882, 0.553, 0.086, 1.00]
# the width is set in the screen pixels
width: 5px
tunnel:
# the filter adds more specific rules to the
# tunnel rendering
filter:
is_tunnel: true
draw:
lines:
color: [0.192, 0.882, 0.086, 1.00]
major_road_tertiary:
filter:
kind: 'major_road'
kind_detail: 'tertiary'
draw:
lines:
color: [0.882, 0.835, 0.086, 1.00]
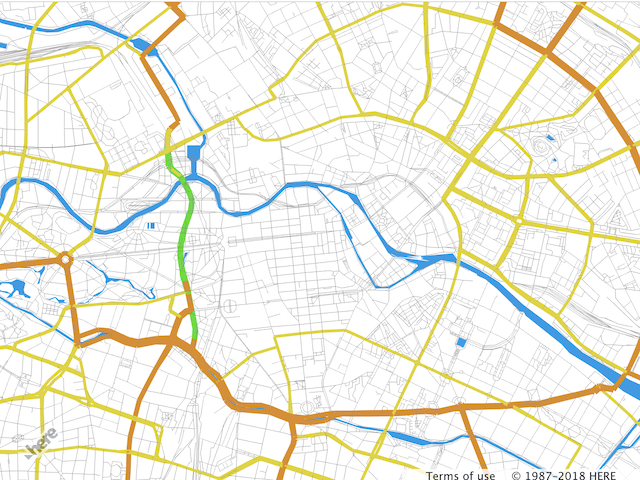
width: 3pxThe tunnel subsection from the YAML configuration from the preceding example changes secondary road tunnel color. The following figure demonstrates the result:
For more information and use case examples, see Style feature filters.
Render dashed lines
Map features, such as country borders, railroads, and ferry lines, require dashed lines. The lines style provides an easy way to render a dashed line. The property dash contains an array of numbers describing the dash pattern. The behavior of this property is similar to that of the segments element in the HTML5 Canvas setLineDash. The following example adds a specific rule to draw the railroads as dashed lines.
rail:
filter:
kind: 'rail'
draw:
lines:
# define the dash period
dash: [3, 3]
# dash foreground color
color: '#FFFFFF'
# dash background color
dash_background_color: '#FFAAAA'
width: 8px
# outline of the line
outline:
color: '#FFAAAA'
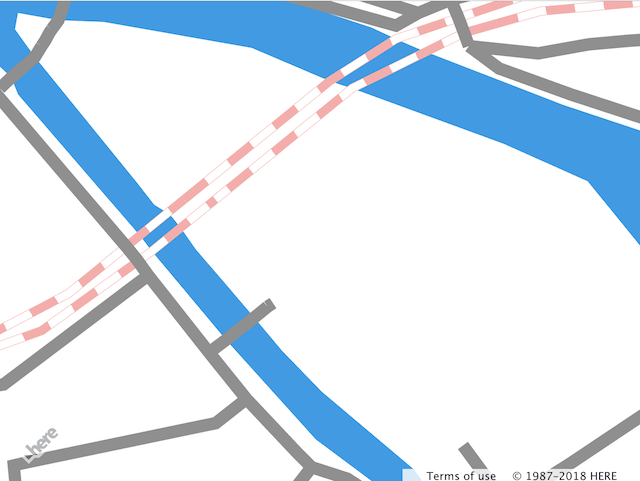
width: .5pxWhen you add the snippet from the preceding example to the road section, the railroads appear dashed pink as shown on the following image:
Change the map style at runtime
You can query and change style information during the map lifetime to highlight features according to new business rules or remove layers that are currently not required in the application. You can use the following methods from the H.map.render.webgl.Style class to modify map style during runtime:
extractConfig- Returns the subsection if the configuration method can return either the cloned copy or the section itself. In the latter case, the API deletes the layer from the configuration and is no longer displayed on the map.mergeConfig- Merges the configurations supplied by the caller and the provider.getConfig- Returns the complete cloned copy of the style configuration as a JavaScript Object. This can be useful if you instantiate the second version of the map with the configuration currently in use, or for the map style inspection.
In the following snippet, the API retrieves the park layer from the base layer configuration. The color of the park layer changes to bright red and the API merges the configuration back into the base layer.
// Assuming that the platform and map were initialized, and
// the map uses vector base layer
// get the OMV provider from the base layer
var provider = map.getBaseLayer().getProvider();
// get the style object for the base layer
var parkStyle = provider.getStyle();
// query the sub-section of the style configuration
// the call removes the subsection from the original configuration
// NOTE: the style MUST be in the "READY" state
var parkConfig = parkStyle.extractConfig(['landuse.park']);
// change the color, for the description of the style section
// see the Developer's guide
parkConfig.layers.landuse.park.draw.polygons.color = '#FF0000'
// merge the configuration back to the base layer configuration
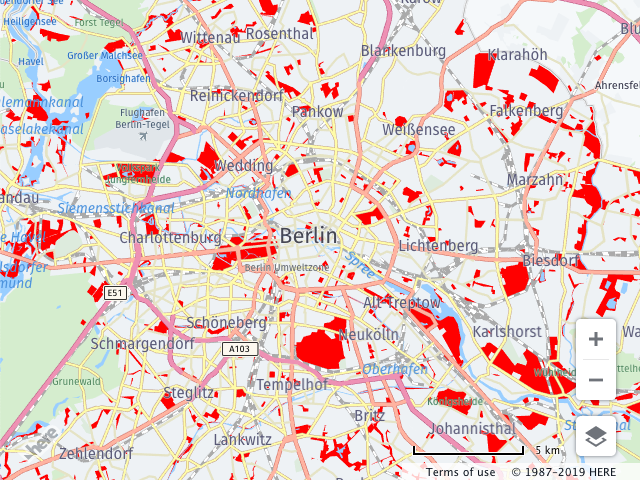
parkStyle.mergeConfig(parkConfig);The following figure shows the output of the configuration changes from the preceding code snippet:
Hint
For the style runtime configuration changes to take effect, you must ensure that the map style state is
READY. Otherwise, the browser console might display theIllegalOperationError: H.map.render.webgl.Style#mergeConfig style is not ready yetpreventing you from updating the map style. The following code snippet shows how to use the style event handler to ensure that the style reaches theREADYstate before applying any custom updates at runtime.// Get the base layer's style from the map const style = map.getBaseLayer().getProvider().getStyle(); // Function to change the style when it's ready const changeStyle = (style) => { // Extract the configuration for the 'landuse.park' layer const parkConfig = style.extractConfig(['landuse.park']); // Update the color of park polygons to red parkConfig.layers.landuse.park.draw.polygons.color = '#FF0000'; // Merge the updated configuration back into the style style.mergeConfig(parkConfig); } // Event handler for style changes const handler = (evt) => { // Get the style from the event target const style = evt.target; // Check if the style is in the 'READY' state if (style.getState() === H.map.render.Style.State.READY) { // Remove the 'change' event listener, as we only need to change the style once style.removeEventListener('change', handler); // Call the function to change the style changeStyle(style); } }; // Check if the style is already in the 'READY' state if (style.getState() === H.map.render.Style.State.READY) { // The style is already ready, so we can directly change it changeStyle(style); } else { // The style is not ready, so it's either loading or hasn't loaded yet // We listen for the 'change' event and will handle the style change when it's ready style.addEventListener('change', handler); }For more information, see the
H.map.render.Styledocumentation in the API Reference.
Next steps
- For information on the proper structure for the map styling information, see Scene structure overview.
- For more information on the Maps API for JavaScript design and features, see API Reference.
Updated last month