Customize maps with map controls and UI
Note
The 3.1 version of this API has been deprecated. For continued support and feature development, upgrade to the latest 3.2 version.
UI controls in the Maps API for JavaScript improve user interaction and make mapping applications more user-friendly. These controls enhance usability and provide essential map information. By utilizing these controls, you can create engaging mapping applications tailored to your specific requirements.
The Maps API for JavaScript includes a UI module called mapsjs-ui.js that offers a collection of pre-built map controls which can be quickly integrated into your application. The default UI controls include the following components:
MapSettingsControl- Enables users to switch between the Map view and the Satellite view, catering to diverse use cases and preferences. In addition, this component provides real-time traffic information on the map, including traffic flow, incidents, and congestion, enabling users to make informed decisions while travelling.ZoomControl- Allows users to zoom in and out of the map, providing a familiar and convenient way to control the map's zoom level.Scalebar- Displays a graphical representation of the map's scale, helping users understand the relative sizes and distances on the map.
In addition to the default UI controls, the UI module supports the creation of multiple additional UI controls that can further enhance the functionality and user experience of your mapping application. These components include:
DistanceMeasurement- Enables users to measure distances between points on the map, facilitating the understanding of the length or route between different locations.ZoomRectangle- Allows users to define a rectangular area on the map and zoom in to that specific region, providing a more detailed view of a particular area of interest.InfoBubble- Supports the creation of info bubbles, interactive pop-ups that provide additional information or context-specific details on the map. Info bubbles can be customized to show relevant data or actions for specific map elements.Overview- Displays a small preview map, highlighting the current viewport of the main map.
The following sections provide steps on how to enhance the functionality of your mapping application by incorporating various types of UI controls.
Create a base map
Create an HTML container and define base JavaScript code for rendering the HERE map.
-
Within the HTML file, ensure that the
<head>element references the required library components, as shown in the following example:<script type="text/javascript" src="https://js.api.here.com/v3/3.1/mapsjs-core.js"></script> <script type="text/javascript" src="https://js.api.here.com/v3/3.1/mapsjs-service.js"></script> <script type="text/javascript" src="https://js.api.here.com/v3/3.1/mapsjs-mapevents.js"></script> -
Within the HTML
<head>element, add the<style>tag with a CSS style definition your map container. For example, you can use the following basic style that sets the map viewport to 100% height and width of the enclosing container:body { width: 100%; height: 100%; position: absolute; margin: 0px; padding: 0px; overflow: hidden; } #map { position:absolute; top:0; bottom:0; width:100%; height: 100%; } -
Within the
<body>element, add the<div id="map"></div>contaner for your map object. -
Within the
<body>element and inside<script>tag, use the Maps API for JavaScript to create a base map that consists of the default layers by pasting or referencing the following code snippet:// Initiate and authenticate your connection to the HERE platform: const platform = new H.service.Platform({ 'apikey': 'your API key' }); // Obtain the default map types from the platform object: const defaultLayers = platform.createDefaultLayers(); // Instantiate (and display) a map: const map = new H.Map( document.getElementById("map"), // Center the map on Dublin, Republic of Ireland, with the zoom level of 10: defaultLayers.vector.normal.map, { zoom: 11, center: { lat: 53.349805, lng: -6.260310 } }); // MapEvents enables the event system. // The behavior variable implements default interactions for pan/zoom (also on mobile touch environments). const behavior = new H.mapevents.Behavior(new H.mapevents.MapEvents(map)); // Enable dynamic resizing of the map, based on the current size of the enclosing cntainer window.addEventListener('resize', () => map.getViewPort().resize()); -
In the JavaScript code snippet, replace the value of the
apikeyvariable with your own API key.
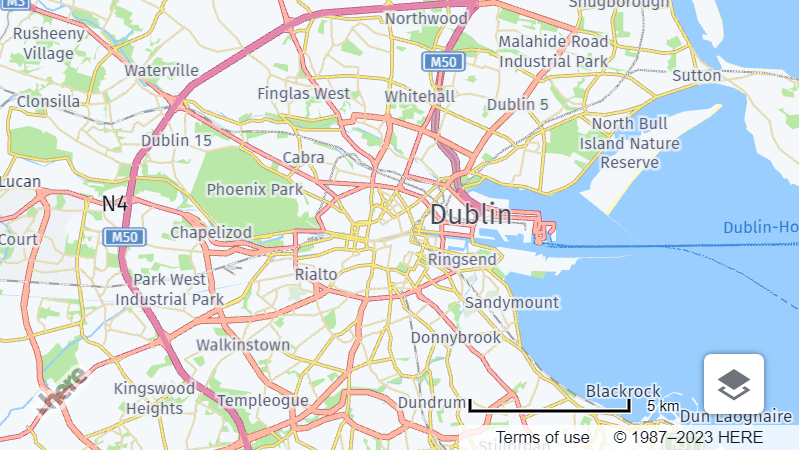
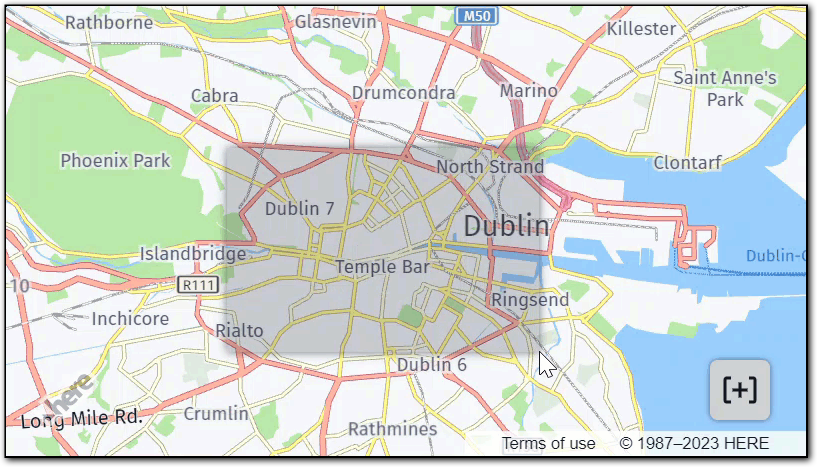
Result: The HTML file displays a basic map, as shown in the following example:
Add the default UI controls to the map
The default UI controls in the Maps API for JavaScript save development time, improve usability, and provide customization options, resulting in a more efficient and user-friendly mapping application.
-
Load the Maps API for JavaScript UI module and a link to the corresponding CSS style by adding the following tags to the
<head>element of your HTML file:<script type="text/javascript" charset="utf-8" src="https://js.api.here.com/v3/3.1/mapsjs-ui.js" ></script> <link rel="stylesheet" type="text/css" href="https://js.api.here.com/v3/3.1/mapsjs-ui.css" /> -
Modify the JavaScript code for map rendering by adding the following snippet after the code responsible for map instantiation:
// Create the default UI:
const ui = H.ui.UI.createDefault(map, defaultLayers);
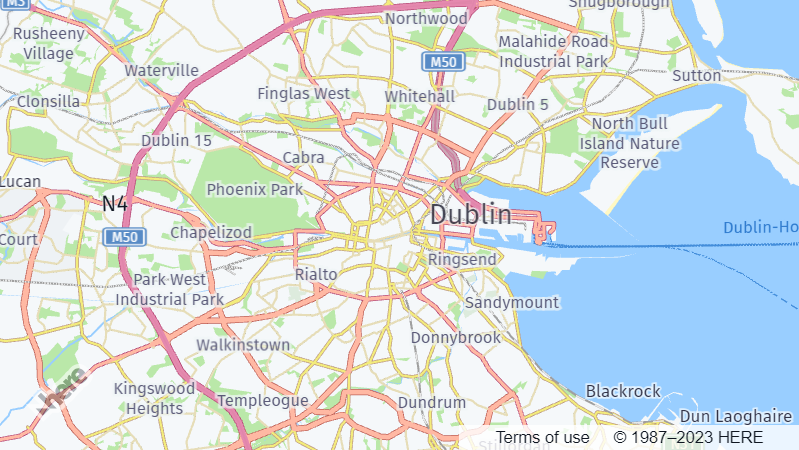
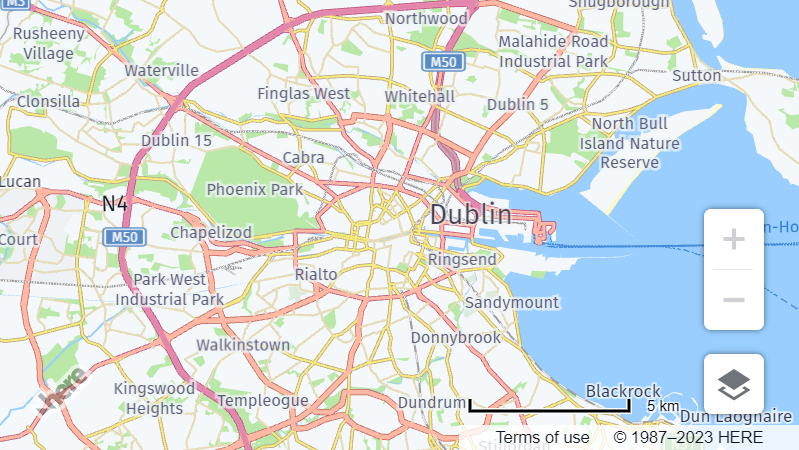
Result: The map now shows the default controls. You can use the + and - buttons to control the map zoom. Use the map selector to modify the map style or display such additional data as traffic conditions or incidents. Finally, the scalebar helps you to understand distances and sizes, relative to the current zoom level. The following figure showcases the capabilities of the default UI components:
Customize the default UI controls
Customizing the default UI controls in the Maps API for JavaScript enables you to tailor the user interface to match your specific application's needs and branding.
Change the UI language
The API provides localization support for UI controls, enabling you to display the UI controls in different languages based on the user preferences or your application requirements.
The UI module comes with localizations for the following languages:
en-US– English (United States)de-DE– Germanes-ES– Spanishfi-FI– Finnishfr-FR– Frenchit-IT– Italiannl-NL– Dutchpl-PL– Polishpt-BR– Portuguese (Brazil)pt-PT– Portuguese (Portugal)ru-RU– Russiantr-TR– Turkishzh-CN– Chinese (China)
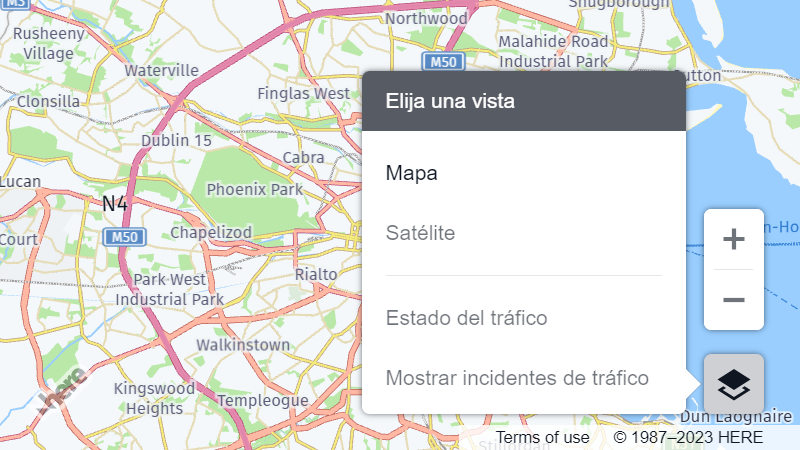
To change the language of the default UI controls, use the corresponding language code when creating the default UI controls. The following example shows how to change the language to Spanish:
// Create the default UI:
const ui = H.ui.UI.createDefault(map, defaultLayers, `es-ES`);Result: The language of the UI controls changes according to your settings, as shown in the following figure:
Manage the position of UI controls
The API provides methods to control the alignment and positioning of UI controls on the map.
You can manipulate each control individually through calls to the getControl() method that is defined on the H.ui.UI class. To identify the control to manipulate, use the corresponding control name:
'mapsettings'for theMapSettingsControl'zoom'for theZoomControl'scalebar'for theScaleBar
To manage the position of a control, you must first access the target control. For example, you can use the following pattern:
// Ensure that you access the control after you initialized the UI
const ui = H.ui.UI.createDefault(map, defaultLayers);
const control = ui.getControl('controlName'); // Replace 'controlName' with the name of the control you want to manage, for example, 'mapsettings.'
The following sections provide examples on how you can manipulate the position of a control on a map, as required.
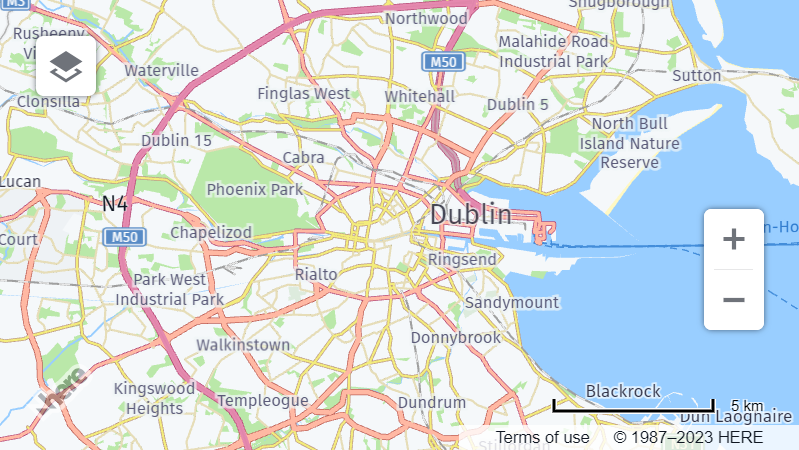
Set the alignment of a UI control
To adjust a control alignment on map, use the setAlignment() method, as shown in the following example:
const mapSettingsControl = ui.getControl('mapsettings');
mapSettingsControl.setAlignment('top-left');Result: The position of the control changes according to your input, as demonstrated in the following example:
For more alignment options, see the setAlignment() method documentation in the API Reference.
Hide or display a UI control
If required by your use case, you can dynamically hide or display a UI control. The following example shows how to hide the ZoomControl:
const zoomControl = ui.getControl('zoom');
zoomControl.setVisibility(false);Result: The ZoomControl is now hidden, as show in the following figure:
For more information, see the setVisibility() method documentation in the API Reference.
Disable a UI control
Disabling a control means that the control is visually grayed out and cannot be interacted with by the user. Disabling a UI control typically indicates that the associated functionality is currently not available or not applicable in the current context.
The following example showcases disabling the ZoomControl:
const zoomControl = ui.getControl('zoom');
zoomControl.setDisabled(true);Result: The map still displays the ZoomControl but the control is not interactive, as shown in the following example:
For more information, see the setDisabled() method documentation in the API Reference.
Add the overview map control
The Overview control in the Maps API for JavaScript displays a scaled-down representation of the map.
By default, the overview map displays a smaller version of the current viewport. For example, to adjust the overview map to your business use case, you can modify this behavior to show a wider area by adjusting the zoom level and the size of the overview map. This way, users can get a better sense of the surrounding area and navigate within the map more effectively.
The following code snippet provides an example on how to add an Overview control:
// Create a map layer for the overview control
const overviewLayers = platform.createDefaultLayers();
// Instatiate the overview map by using the H.ui.Overview constructor
const overviewMap = new H.ui.Overview(overviewLayers.raster.satellite.map, {
    //Set the control position and the map size and zoom parameters with respect to the map's viewport
    alignment: H.ui.LayoutAlignment.LEFT_BOTTOM,
    zoomDelta: 6,
    scaleX: 5,
    scaleY: 6
});
// Add the control to the map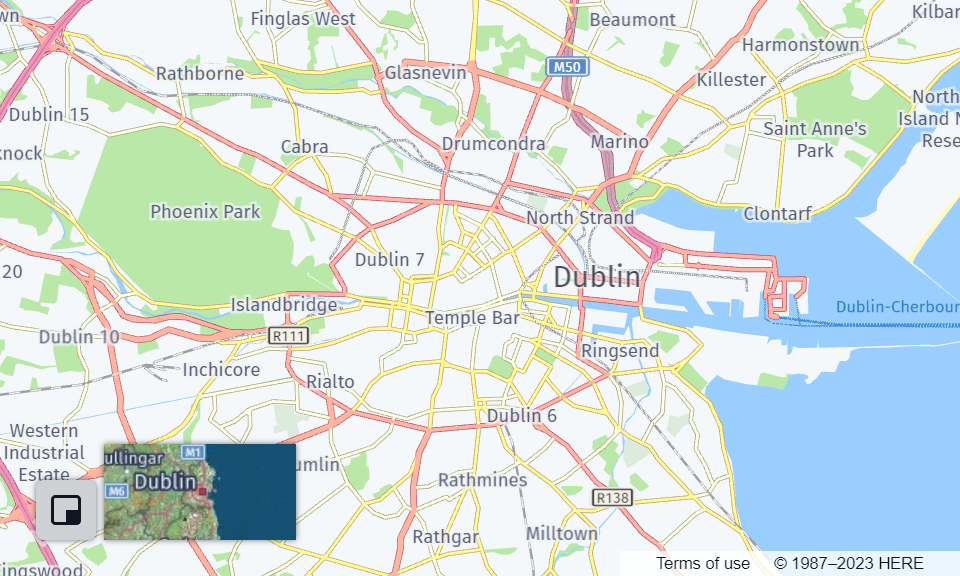
ui.addControl('overview', overviewMap);Result: The map now displays the Overview control. When interacted with, the control provides a small raster satellite overview map, as highlighted in the following figure:
For more information, see the H.ui.Overview class documentation in the API Reference.
Add an info bubble
The info bubble is useful for providing additional information about specific map locations or objects. It can be used to display details such as the name of a place, address, contact information, or any other relevant information related to the map feature. Users can interact with the info bubble to view the information and can close it when no longer needed.
The following example shows how to add an info bubble for a landmark in Dublin, Republic of Ireland:
// Create the coordinates for the Spire of Dublin
const spireCoordinates = {
    lat: 53.349805,
    lng: -6.260310
};

// Create the HTML content for the info bubble
const content = '<div>' +
    '<h3>Spire of Dublin</h3>' +
    '<p>Learn more on <a href="https://en.wikipedia.org/wiki/Spire_of_Dublin" target="_blank">Wikipedia</a>.</p>' +
    '</div>';

// Create an info bubble at the Spire of Dublin location with the HTML content
const infoBubble = new H.ui.InfoBubble(spireCoordinates, {
    content
});

// Add the info bubble to the UI
ui.addBubble(infoBubble);Result: The map displays an info bubble at the specified coordinates, as shown in the following example:
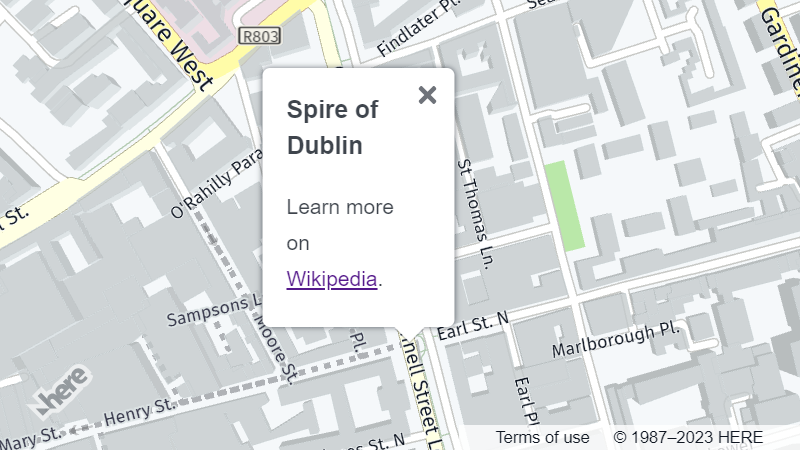
For more information, see the H.ui.InfoBubble class documentation in the API Reference.
Add the zoom rectangle control
With ZoomRectangle, users can define an area on the map by drawing a rectangle and have the map automatically zoom to that area.
When exploring a large map, the zoom rectangle allows users to define the exact boundaries of their area of interest and quickly zoom in to focus on that specific area, without having to manually adjust the zoom level or panning the map.
The following code snippet shows how to add the Zoomrectangle control to the map:
const zoomRectangle = new H.ui.ZoomRectangle({
    // Position the control on the map's viewport
    alignment: H.ui.LayoutAlignment.RIGHT_BOTTOM
});
ui.addControl('rectangle', zoomRectangle);Result: You can now zoom in on a particular area of interest by using the ZoomRectangle control, as shown in the following example:
For more information, see the H.ui.ZoomRectangle class documentation in the API Reference.
Add the distance measurement control
With the DistanceMeasurement control, users can measure distances between different locations to plan their routes effectively. The control helps in estimating travel distances, identifying the shortest or most efficient path, and determining the overall distance to be covered.
The following example demonstrates how to add a distance measurement control with custom SVG marker icons:
// Create a template for marker icons by using custom SVG style
function createMarkerIcon(color) {
  return `<svg xmlns="http://www.w3.org/2000/svg" width="24" height="32" viewBox="0 0 24 32">
    <path d="M12 0C6.48 0 2 4.48 2 10c0 5.057 3.333 14.5 10 22 6.667-7.5 10-16.943 10-22 0-5.52-4.48-10-10-10zm0 14c-1.657 0-3-1.343-3-3s1.343-3 3-3 3 1.343 3 3-1.343 3-3 3z"
    fill="${color}" stroke="#FFFFFF"/>
  </svg>`;
}

// Define the colors for the icons
const startColor = "#00008B";
const stopoverColor = "#8AC9C9";
const splitColor = "#A2EDE7";
const endColor = "#990000";

// Create the icons with respective colors
const startIcon = new H.map.Icon(createMarkerIcon(startColor));
const stopoverIcon = new H.map.Icon(createMarkerIcon(stopoverColor));
const endIcon = new H.map.Icon(createMarkerIcon(endColor));
const splitIcon = new H.map.Icon(createMarkerIcon(splitColor));

// Create the DistanceMeasurement control
const distanceMeasurementTool = new H.ui.DistanceMeasurement({
  startIcon: startIcon,
  stopoverIcon: stopoverIcon,
  endIcon: endIcon,
  splitIcon: splitIcon,
  lineStyle: {
    strokeColor: "rgba(95, 229, 218, 0.5)",
    lineWidth: 6
  },
  alignment: H.ui.LayoutAlignment.RIGHT_BOTTOM
});

// Add the DistanceMeasurement control to the UI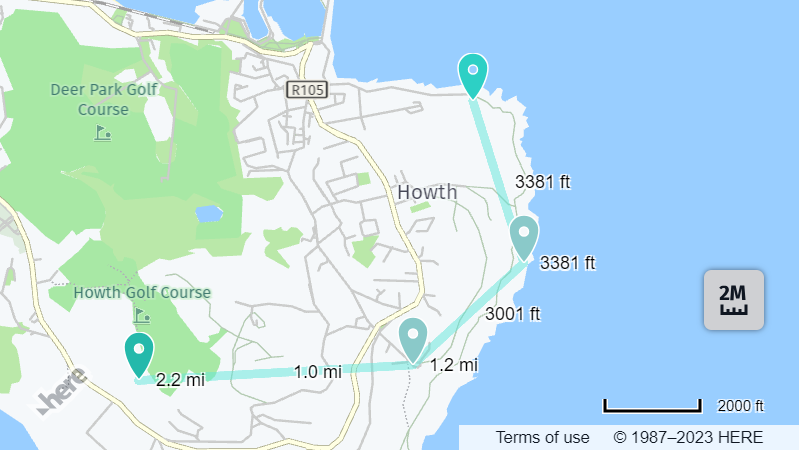
ui.addControl("distancemeasurement", distanceMeasurementTool);Result: You can now use the control to measure distances between various points on the map, as shown in the following example:
As shown in the preceding example, you can add start, end, and stopover markers, while the Maps API for JavaScript dynamically calculates both the total distance and the distance between each marker. In addition, you can add split markers in-between any of the previously added markers or adjust the position of a marker by dragging it on the map.
For more information, see the H.ui.DistanceMeasurement class documentation in the API Reference.
Change the unit system for the scalebar and distance measurement controls
Users from different regions or countries might be accustomed to different measurement systems. Therefore, switching between metric and imperial units can provide a more familiar and user-friendly experience.
By default, the Maps API for JavaScript uses the metric units for distance and scale measurement. To switch to the imperial system, call the setUnitSystem() method and provide the value corresponding to the measurement system you want to use, as shown in the following example:
ui.setUnitSystem(H.ui.UnitSystem.IMPERIAL);Result: The scalebar and the distance measurement control now use the imperial measurement system, as shown in the following example:
For more information, see the H.ui.UnitSystem class documentation in the API Reference.
Customize the MapSettingsControl when using the HARP engine
You can add MapSettingsControl to your maps with custom elements, allowing users to switch between different map views or toggle map layers using custom map data like GeoJSON and more. The HARP engine allows you to use hybrid layers for map views.
For example, you can create a hybrid view that blends satellite imagery (raster data) with vector elements like roads, landmarks, and boundaries. This combination can be used as a Satellite view in MapSettingsControl, offering a detailed and visually rich representation of geographical features.
Prerequisites: Switch the map engine to HARP
Configure your map to use the HARP engine. For more information, see Migrate to the HARP engine.
For example, the following code snippet creates a basic HARP engine map, inside a map <div> container:
const platform = new H.service.Platform({
    apikey: 'YOUR_HERE_API_KEY'
});

// Step 1: specify engine type. This example uses the HARP engine for rendering hybrid layers.
// HARP engine is not the default engine, and it's not included in the mapsjs-core.js module.
// To use this engine, you need to include mapsjs-harp.js file to your HTML page
const engineType = H.Map.EngineType['HARP'];

// Step 2: create default layers using the created platform
const defaultLayers = platform.createDefaultLayers({ engineType });

// Step 3: initialize a map
const map = new H.Map(document.getElementById('map'),
	defaultLayers.vector.normal.map, {
	engineType,
	center: {lat: 52.51477270923461, lng: 13.39846691425174},
	zoom: 13,
	pixelRatio: window.devicePixelRatio || 1
});
// add a resize listener to make sure that the map occupies the whole container
window.addEventListener('resize', () => map.getViewPort().resize());

//Step 4: make the map interactive
// MapEvents enables the event system
// Behavior implements default interactions for pan/zoom (also on mobile touch environments)
const behavior = new H.mapevents.Behavior(new H.mapevents.MapEvents(map));
The previous example creates a basic map but does not include the settings to toggle map layers.
Define hybrid styles as the base layer for the MapSettingsControl
To let users switch between different map layers, add a custom MapSettingsControl that uses a hybrid layer as the base for the Satellite view. You can also include additional map controls for enhanced functionality, as shown in the snippet below:
//Step 5: Set up map settings and other UI controls
var mapSettingsControl = new H.ui.MapSettingsControl({
'baseLayers': [
{
'label': 'Map',
'layer': defaultLayers.vector.normal.map
},
{
'label': 'Satellite',
'layer': [defaultLayers.hybrid.day.raster, defaultLayers.hybrid.day.vector]
}
],
'alignment': H.ui.LayoutAlignment.BOTTOM_RIGHT
});
var scalebarControl = new H.ui.ScaleBar({
'alignment': H.ui.LayoutAlignment.BOTTOM_RIGHT
});
var zoomControl = new H.ui.ZoomControl({
'alignment': H.ui.LayoutAlignment.RIGHT_BOTTOM
});
// Create the custom UI and add the controls
const ui = new H.ui.UI(map);
ui.addControl('zoom', zoomControl);
ui.addControl('mapsettings', mapSettingsControl);
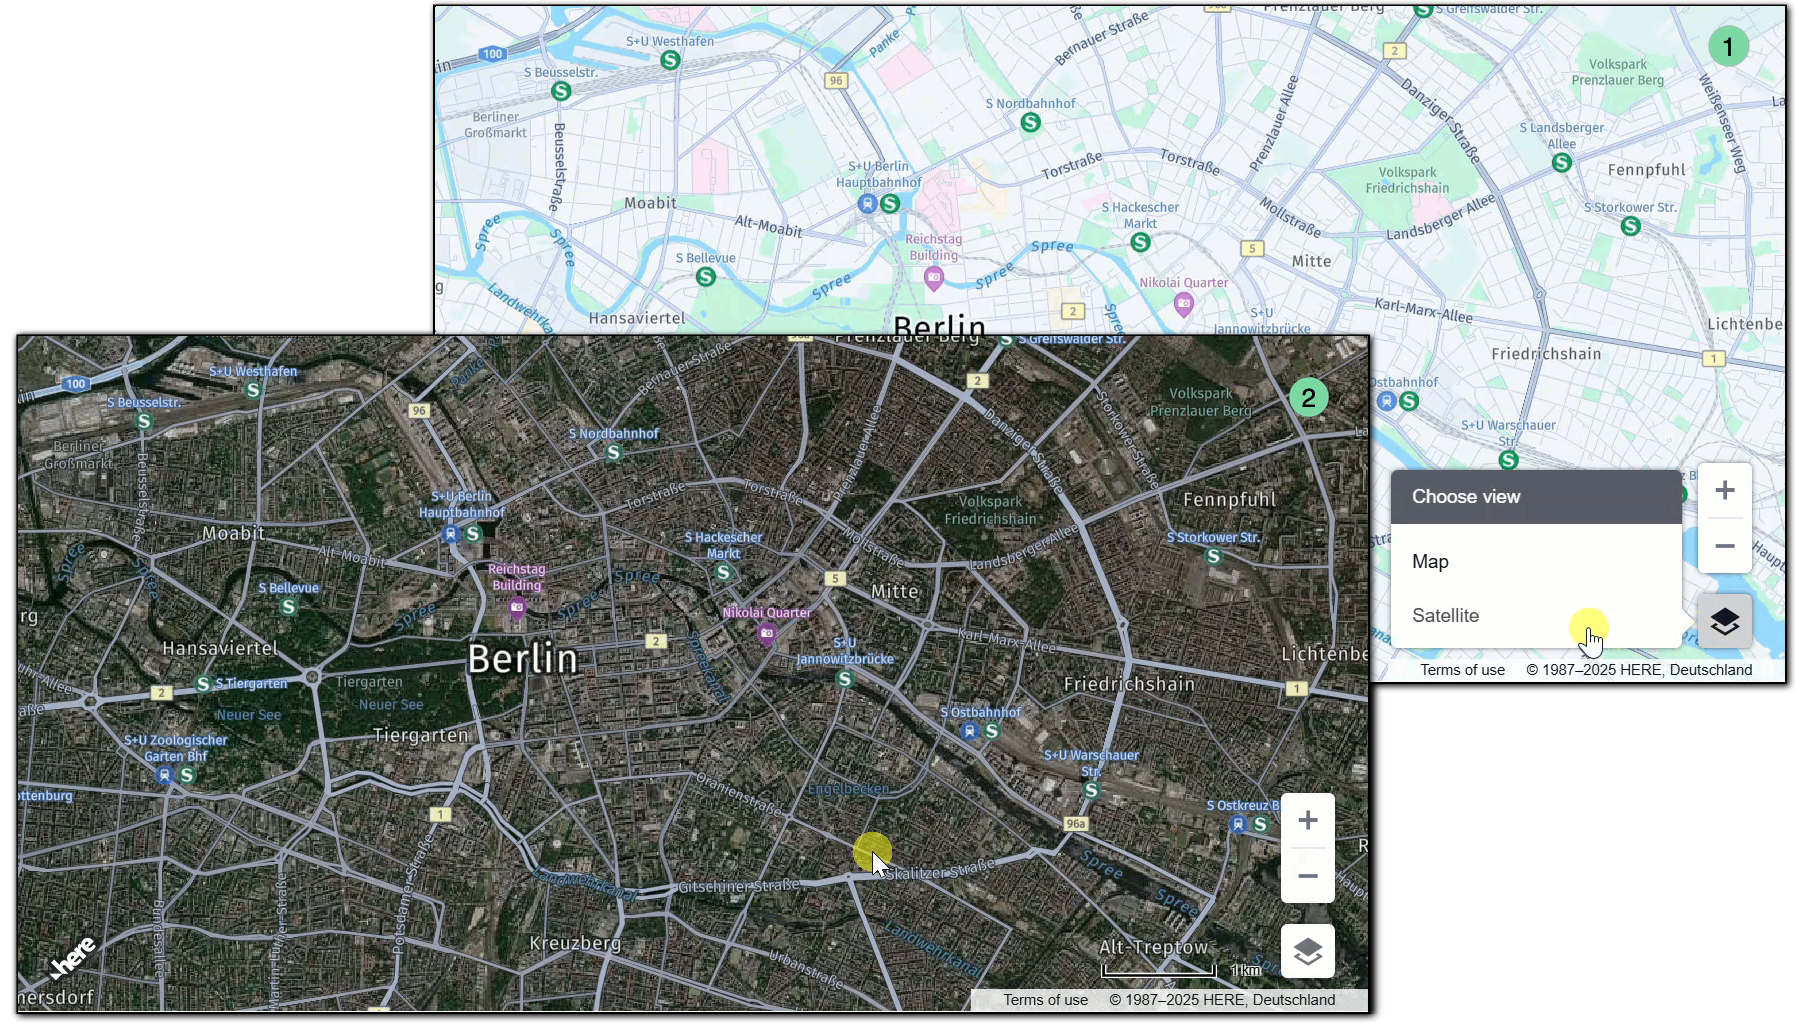
ui.addControl('scalebar', scalebarControl);The following figure shows the resulting map that allows switching between the vector and satellite views. The satellite view combines the vector and raster layers:
Next steps
- For more practical applications of the Maps API for JavaScript, see the
Tutorialssection of this guide. - To explore the design and features of the Maps API for JavaScript, see the API Reference.