

Confidence in the query response
In your query results, the CONFIDENCE field gives a numeric description of the confidence in the Mean Speed field. It's calculated based on the number of observations in the epoch, and the variance of those observations. There are eight possible values for this field, interpreted as follows:
| CONFIDENCE | Meaning |
|---|---|
| 5 | Gap-filled only |
| 10, 15 | Suggestive |
| 20, 25 | Highly suggestive |
| 30, 35 | Confident |
| 40 | Highly confident |
The values ending in 5 (5, 15, 25, and 35) are only found in records generated by the Gap Filling feature. For more information, see the section on Gap filling for Traffic Analytics.
The algorithm for calculating a confidence factor derives from the statistical concept of confidence level, and uses the following general formula:
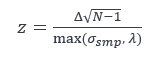
Where N is the number of probe samples, σsmp is their standard deviation, and 𝜆 and Δ are constants based on how probe speed samples are obtained and processed. For example, probe speed samples are always integers, so their calculated standard deviation is higher than if they were more precise. The 𝜆 factor compensates for that. z is a confidence metric, which is then mapped into the ranges shown in the previous table.
Use this field in conjunction with your specific analytical case to control outliers. For example, if you are calculating an average behavior over a period of time, you could choose to omit records marked with the lowest confidence level, to reduce the effect of outliers.