

Sample Traffic Analytics speed data query and results
This tutorial is an example of a Traffic Analytics query and its results. You can click the "?" next to some of the options for more information.
Sign in to Traffic Analytics
To use the Traffic Analytics website, enter this URL https://trafficanalytics.here.com into your web browser and sign in to your account. Your HERE account email must be the same email address you supplied when you licensed Traffic Analytics. This is also the email address where you receive notifications that your data is ready.
Create your query
To create your Traffic Analytics query, follow these steps:
- Click the New Query icon.
- Enter the location where you want Traffic Analytics. For example,
Yorkville, Kendall, Illinois, United States. A map of your location displays. - Enter the date range for the Traffic Analytics. For example,
2022-08-01 to 2022-08-01or one day. - From the drop down options, select Road Names. For example,
US-34in the Road Name field. - Select the day or days of the week, for example
Monday. - Select the time of day for your Traffic Analytics (you can select multiple times of day). For example,
24 Hours. - Select the Output Fields you want to see. For example:
- Average Speed
- Confidence
- Minimum and Maximum Speeds
- Standard Deviation of Speeds
- Length
- Free Flow Speed
- Speed Limit
- Sample Count
- Select your Resolution. For example,
60 minutes. - Select Referencing for your output. For example,
TMC Referenced. - Select Source Data. For example,
Probe Data per Probe, and Path Data. - Select whether you want to
fill gaps. For example, leave this unchecked, with no gap filling. - Select the Vehicle Type. For example,
Passenger + Truck. - Select speed percentiles. For example,
Custom. - Check the boxes of the Speed Percentiles you want to see in your result. For example,
25%, 50%, and 75%. - Click the Submit button to request your Traffic Analytics file.
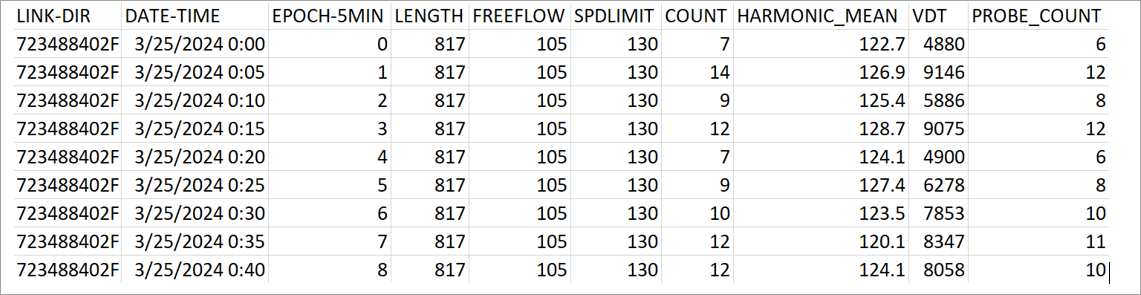
CSV results
Once you have submitted your Traffic Analytics query, wait for an email with links to your CSV and metadata results. Download your CSV results and open them in Excel. You should see something similar to the following results:
Download your metadata results and open them in a text editor. The format of this file may change over time without notice, as options and features change. You should see similar results to the following sample file:
requestId= 123456
userEmail= <YOUR EMAIL ADDRESS>
requestType= PROBE_PATH
Vehicle Type= ALL
beginDate= 20220801
endDate= 20220801
daysOfWeek= [MONDAY]
TimeIntervals= [0000-2359]
inputType= TMC
inputSource= s3://traffic-analytics-pr/2021Q1/queryOutput/1759/20220803-448362/input/HERE_DA_448362.txt
outputType= TMC
outputFilePath= s3://traffic-analytics-pr/2021Q1/queryOutput/1759/20220803-448362/output/
functionalClass= 12345
percentiles= [25, 50, 75]
epochType= 60
reportFields= [LOCATION_REF, DATE, EPOCH, LENGTH, FREEFLOW, SPDLIMIT, COUNT, MEAN, STDDEV, MIN, MAX, CONFIDENCE, PERCENTILES]
outputSize= 1.9 KB
queryTime= Wed, 2022/08/03 17:03:46 UTC
recordCount= 96
total TMC Count=4
totalOutputFiles=1
mapVersion=201H0| Parameter | Description |
|---|---|
| requestIds | An automatically generated number assigned to your query request. |
| userEmail | The email which receives your query results. |
| requestType | PROBE=probe data only; PATH=path data only; PROBE_PATH=probe and path;AGGREGATED_PROBE, AGGREGATED_PATH. |
| Vehicle Type | ALL=passenger vehicles and trucks; PASSENGER=passenger only; TRUCKS=trucks only. |
| beginDate | Start date of your query. |
| endDate | End date of your query. |
| daysOfWeek | SUNDAY, MONDAY, TUESDAY, WEDNESDAY, THURSDAY, FRIDAY, and/or SATURDAY. |
| TimeIntervals | The times you selected; 24 hours=0000-2359. |
| inputType | TMC CODES, ROAD NAME, PVIDs, FUNCTIONAL CLASSES. |
| inputSource | Automatically generated description of query. (For HERE internal use only.) |
| outputType | The referencing type returned with your query results. |
| outputFilePath | Automatically generated file path for your output. (For HERE internal use only.) |
| functionalClass | Functional classes: 1-5. |
| percentiles | The speed percentiles selected in your query. |
| epochType | The resolution selected in your query. |
| reportFields | The output fields selected in your query. |
| outputSize | The size of your query result. |
| queryTime | The time you submitted your query. |
| recordCount | The number of records in your query results. |
| total TMC Count | The number of TMC results in your query results. |
| totalOutputFiles | The number of output files for your query results. |
| mapVersion | The version of the HERE Map used to generate your query results. |