

How to inspect multiple layers
The Data Inspector allows you to inspect up to four datasets at the same time. You can add either layers from the platform or upload local partitions. In addition to inspecting different layers, you can also inspect multiple versions of the same layer simultaneously.
You can use this functionality to visually debug your pipelines by rendering the pipeline output in the portal and overlaying it with the input layer(s).
Data setup
To set up your data:
- In the Control Panel, click the Add Layer button.
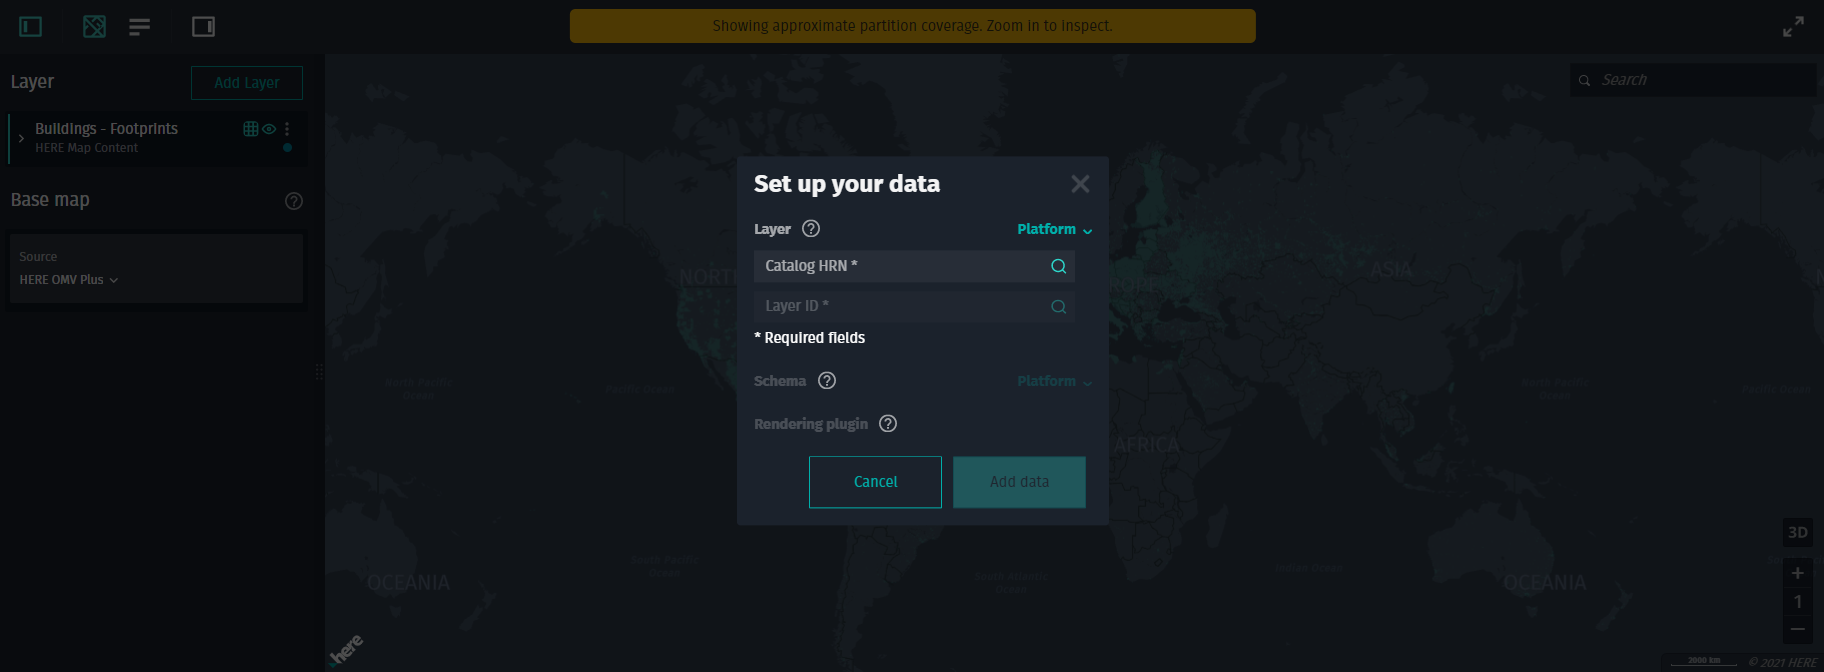
- In the dialog box that opens, choose the source of the data to inspect — Platform or Local File.
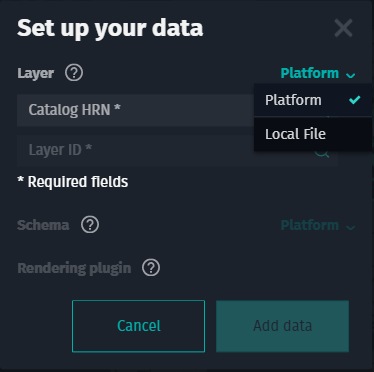
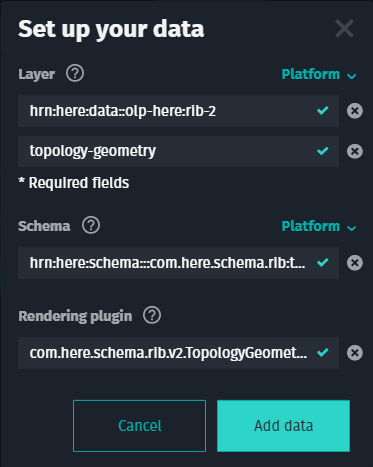
- For Platform, specify the catalog HRN and the layer ID.
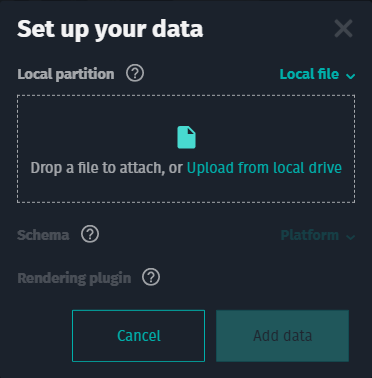
- For Local File, upload a partition from your local machine.
By default, the Data Inspector attempts to detect the schema and the rendering plugin (if available) that are bundled with the layer.
- To select another schema, click the close button
( )
)
next to Schema and specify the schema HRN.
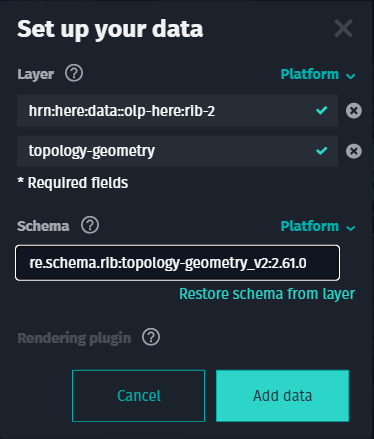
-
Note that you can always restore the default schema from the layer.
-
Alternatively, click Local File and upload a custom schema from your local machine.
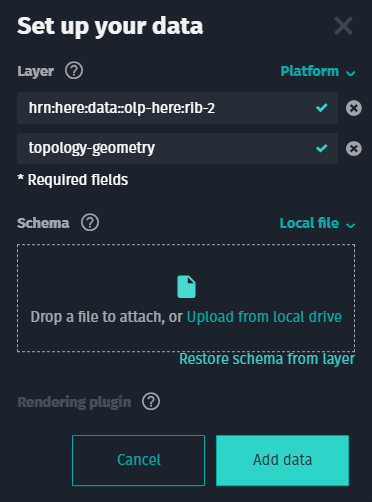
The plugin (if available) is loaded automatically.
- To change the default rendering plugin, click the close button
()
and upload a custom plugin from your local machine.
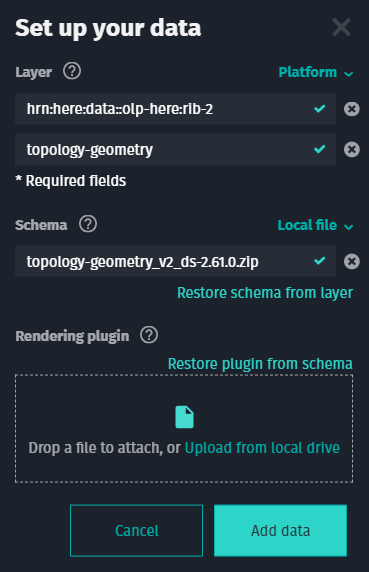
-
Note that you can always restore the default plugin from the schema.
-
Click Add data.
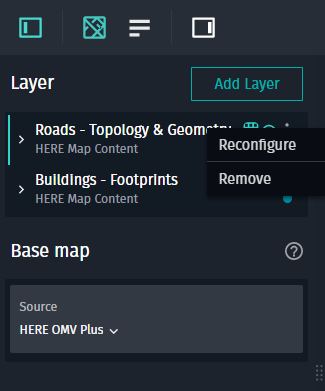
The Roads - Topology & Geometry layer is added to the Layer section of the Control Panel.
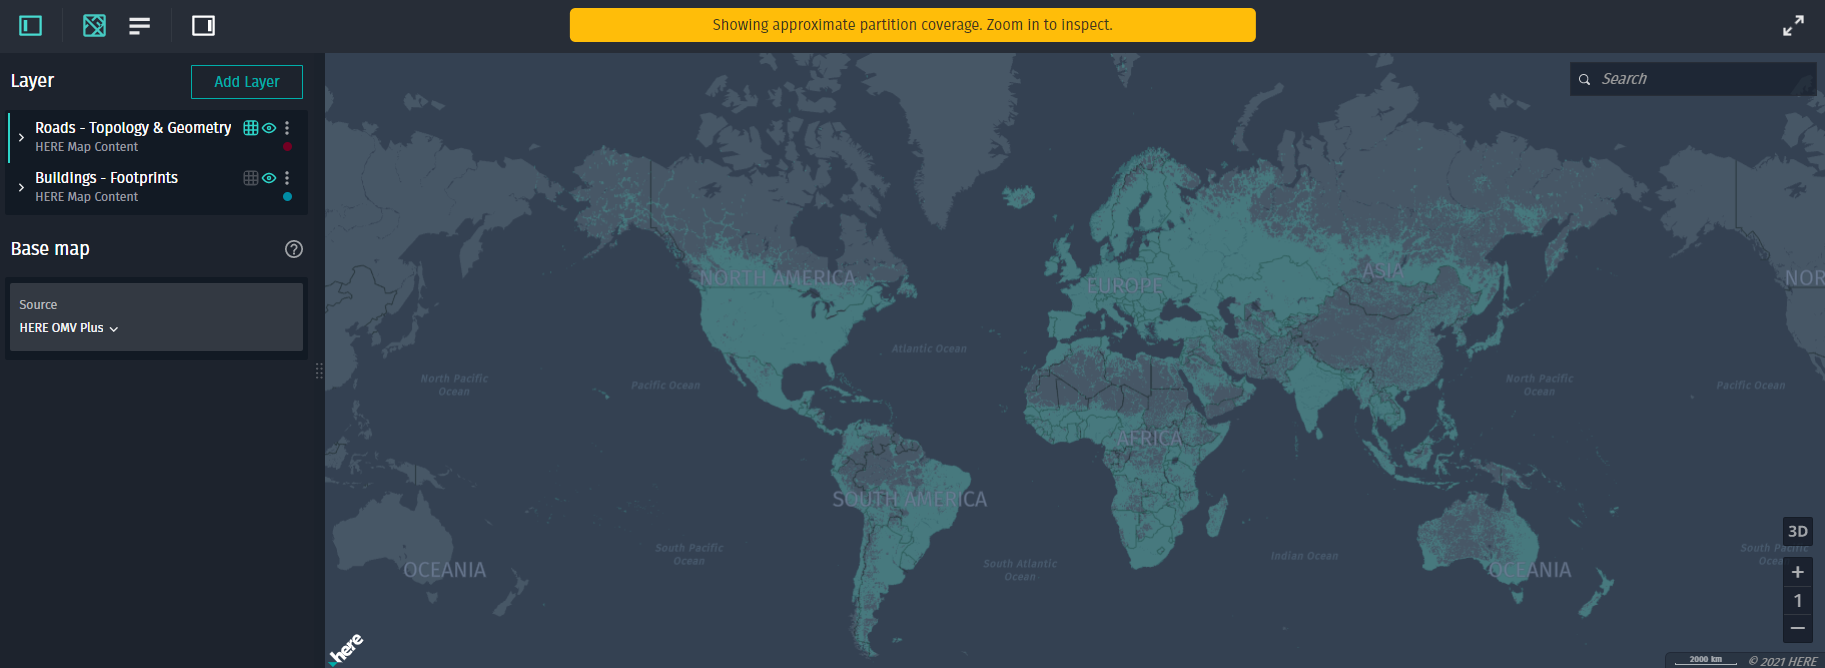
Use the options button
( )
)
next to the layer name to reconfigure or remove the layer from the Control Panel.
Note:
If you are inspecting a specific layer in the Inspect tab on the platform, you cannot reconfigure or remove that layer, as it is considered the primary layer.
Inspection options
- Layer Selection
- Data Visualization
- Layer Order
- Coverage and Heat Maps
- Styling
- Compare Different Versions of the Same Layer
Layer selection
When two or more layers are added to the Control Panel, only one layer is selected at a time. The selected layer is marked with a green vertical line.
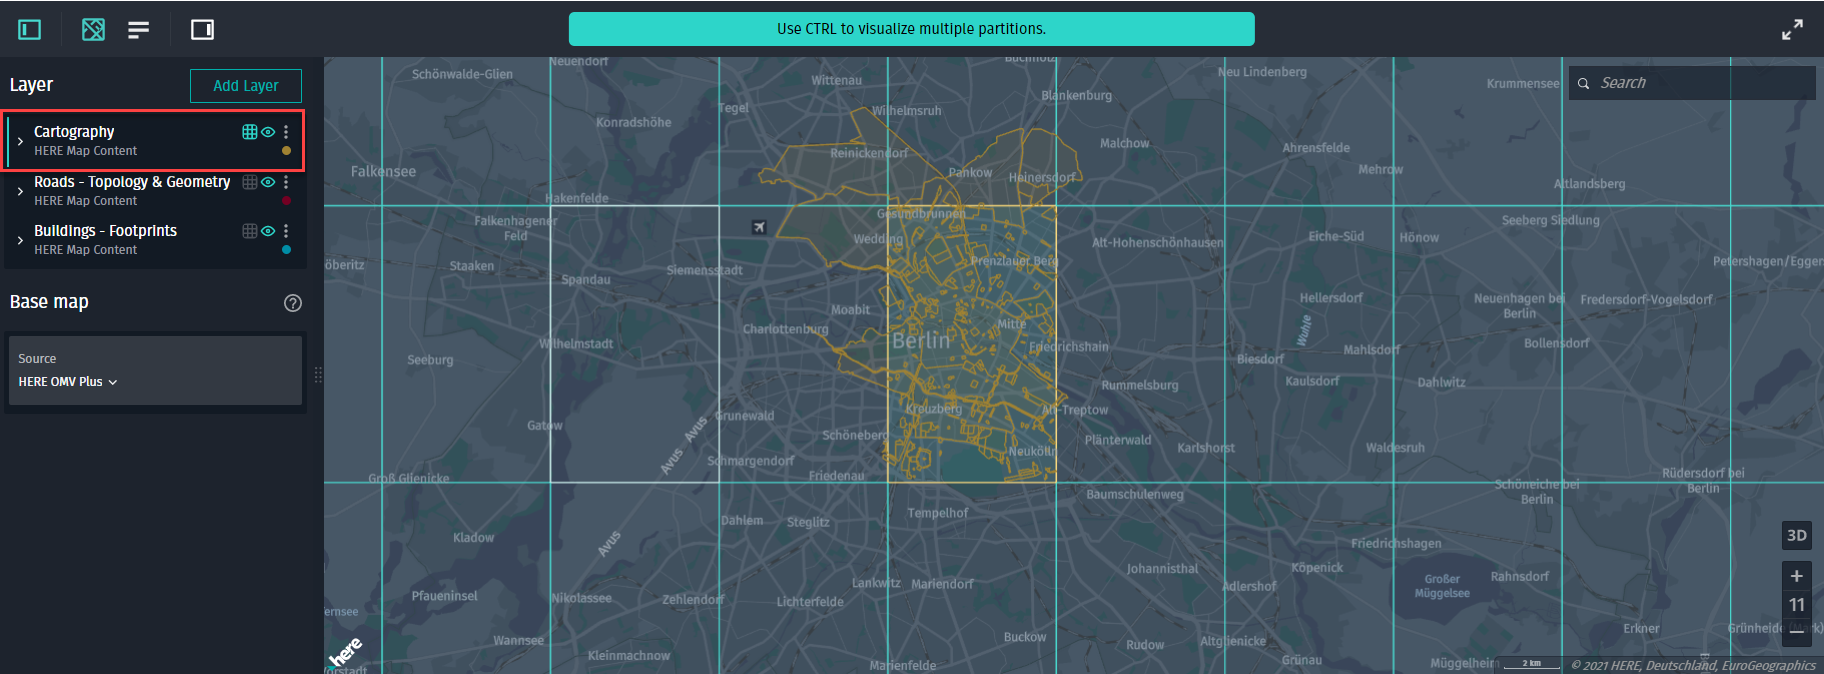
For a selected layer, the following controls are enabled:
- Coverage tile grid
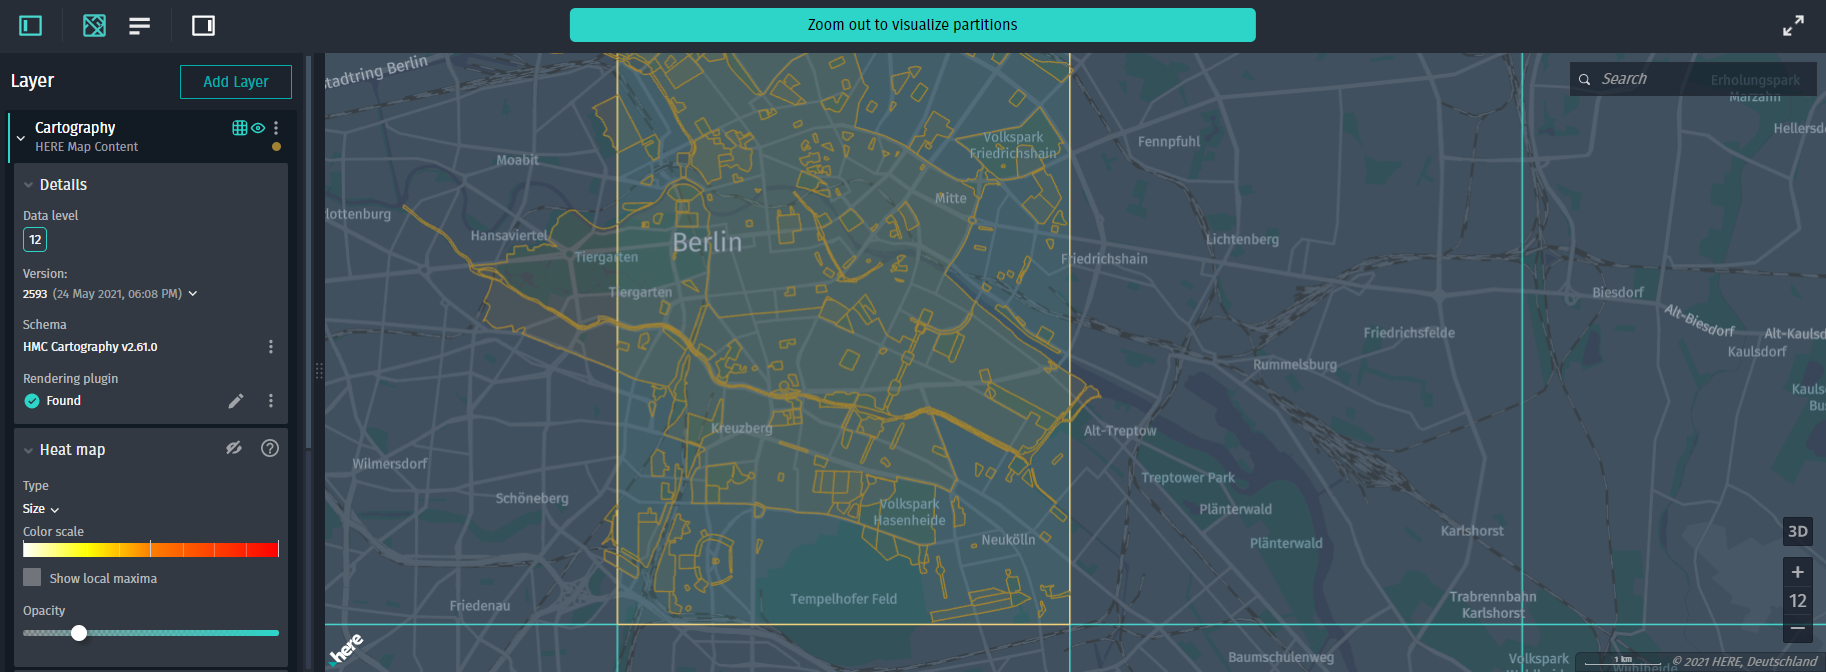
- Data size and freshness heat maps
- Partitions list
Data visualization
When you click a tile to visualize it, data from the selected layer is rendered.
To visualize several layers in a single tile, select another layer in the Control Panel and click the same tile again. Each consecutive dataset is overlaid on top of the previous visualization.
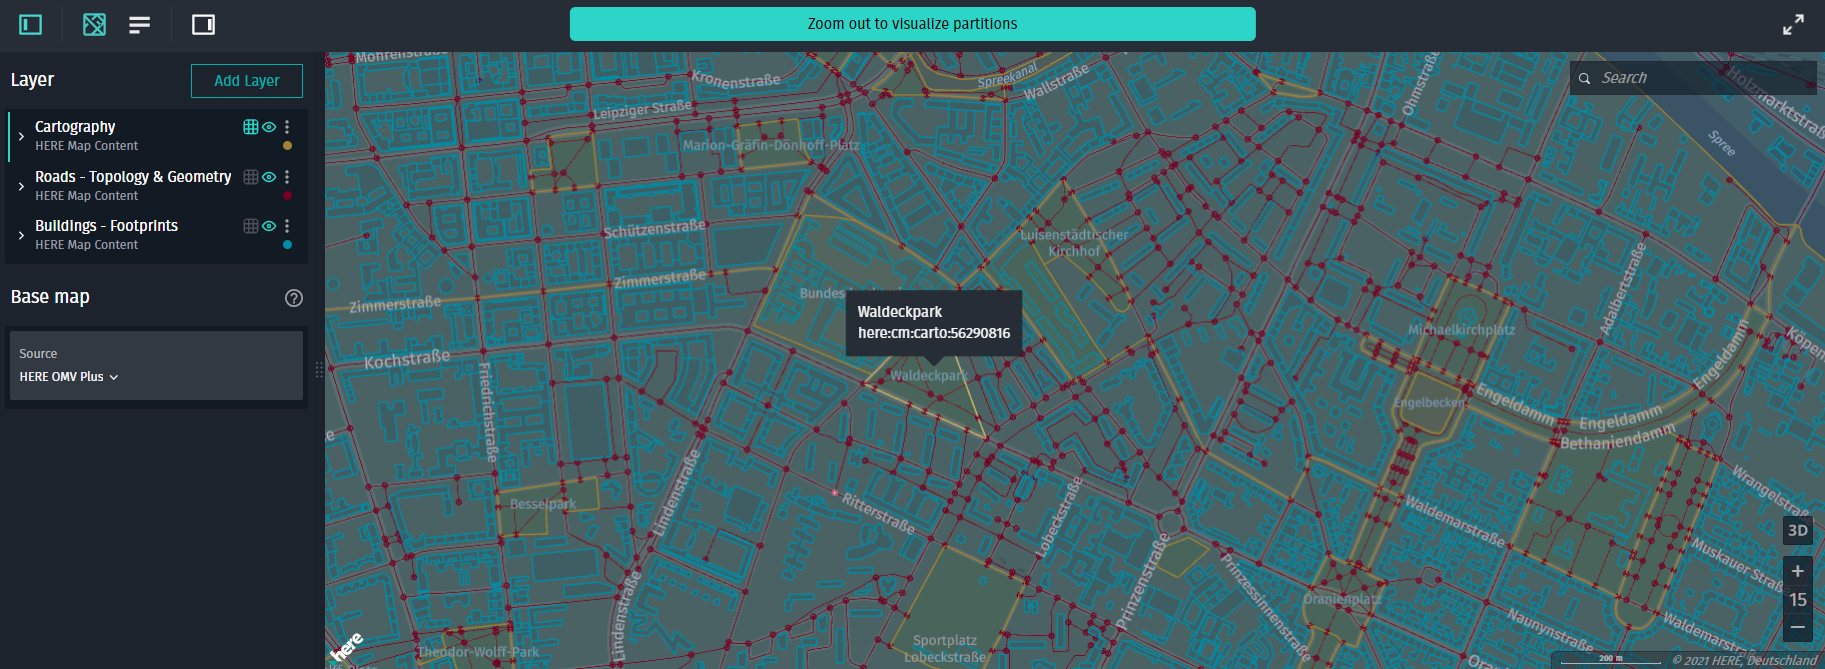
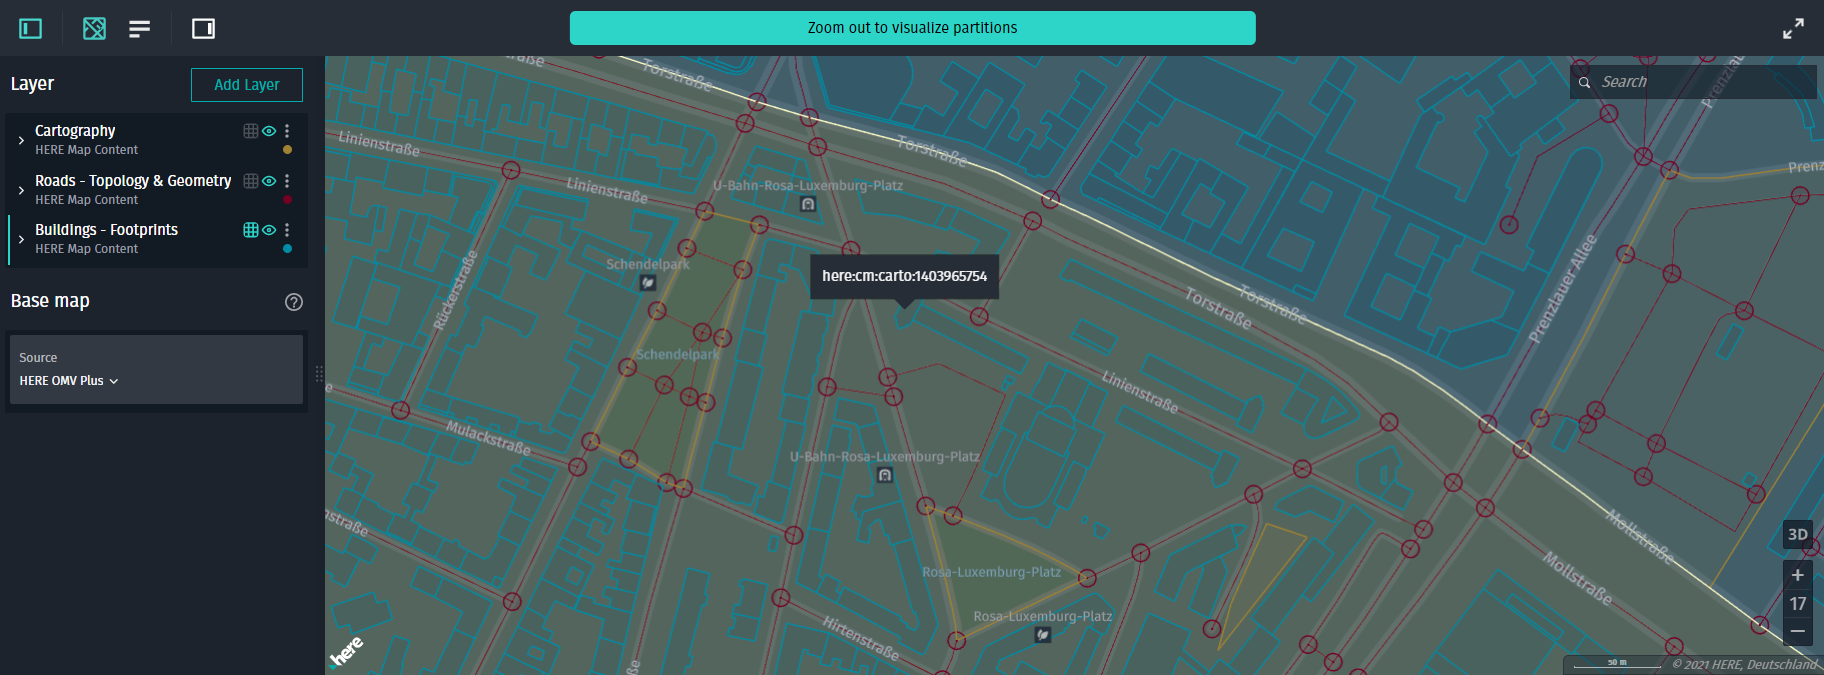
In the example below, cartography data is visualized first, followed by the Roads - Topology & Geometry layer, and then the Buildings - Footprints layer.
Use Ctrl (Cmd) + click to select or deselect multiple tiles.
To quickly show or hide visualized data for a layer, click the eye button
( )
)
next to that layer.
Layer order
Layers in the Control Panel are ordered according to the sequence in which they are added (the last added layer appears first in the list). When clicking through overlaid features from different layers, features are selected based on this layer order.
For example, in the figure below, the first layer is Cartography. As a result, cartographic features are selected first when clicking what appears to be a building. The building itself is selected when clicking the same location a second time.
Coverage and heat maps
When inspecting multiple layers, you can click the tile grid button
( )
)
to choose for which layer to show or hide the tile grid. The tile grid can be enabled for only one layer at a time.
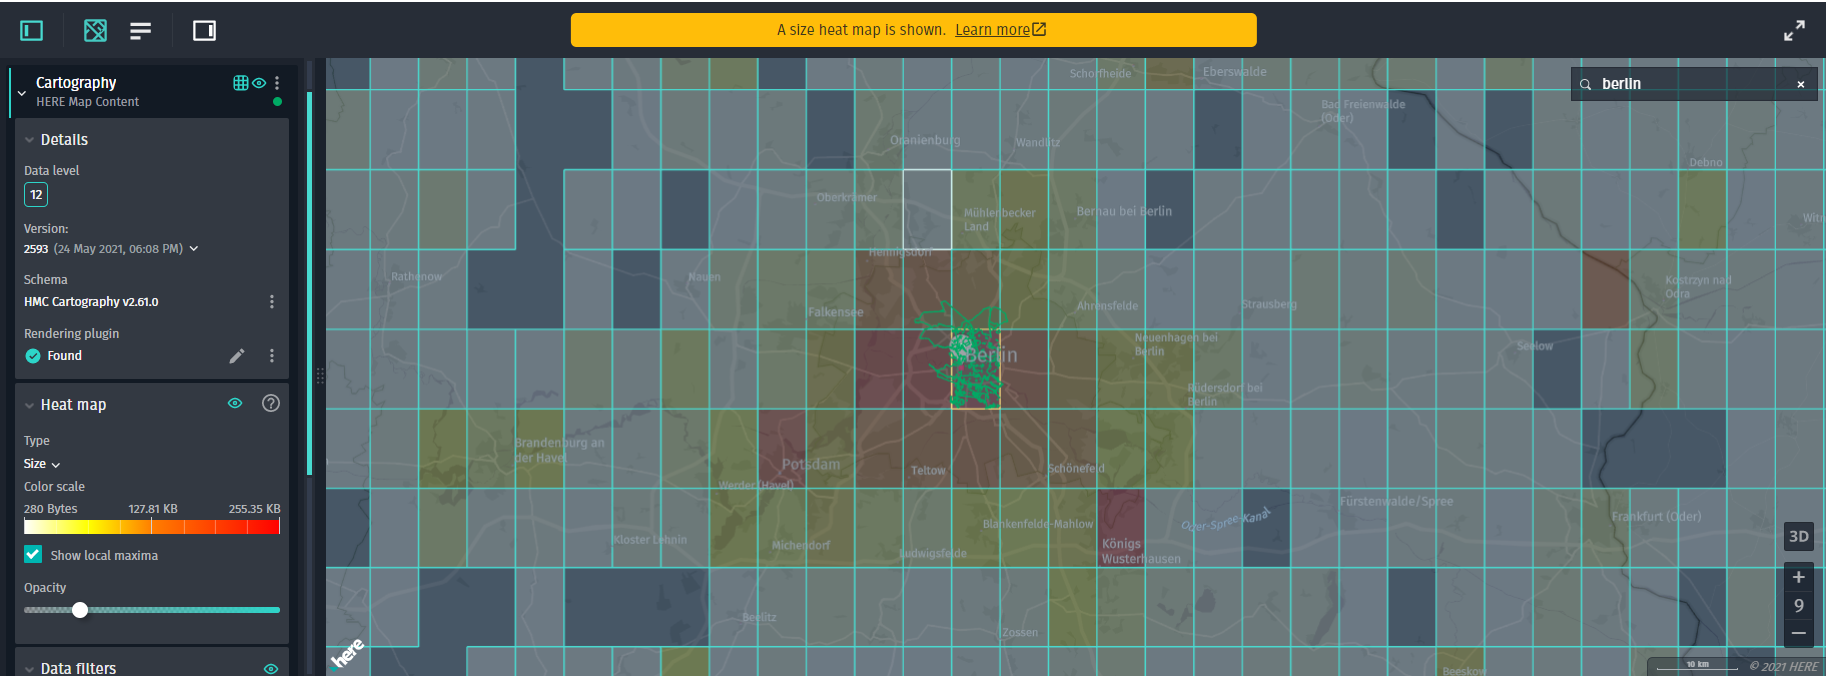
You can remove the tile grid from all layers in the list to reduce map noise.
Heat maps are available only for the selected layer.
For more information about coverage and heat maps, see Analyze Data Coverage.
Styling
To clearly distinguish which layer (or layer version) a visualized feature belongs to, you can use a preset color palette to style the visualization of each dataset.
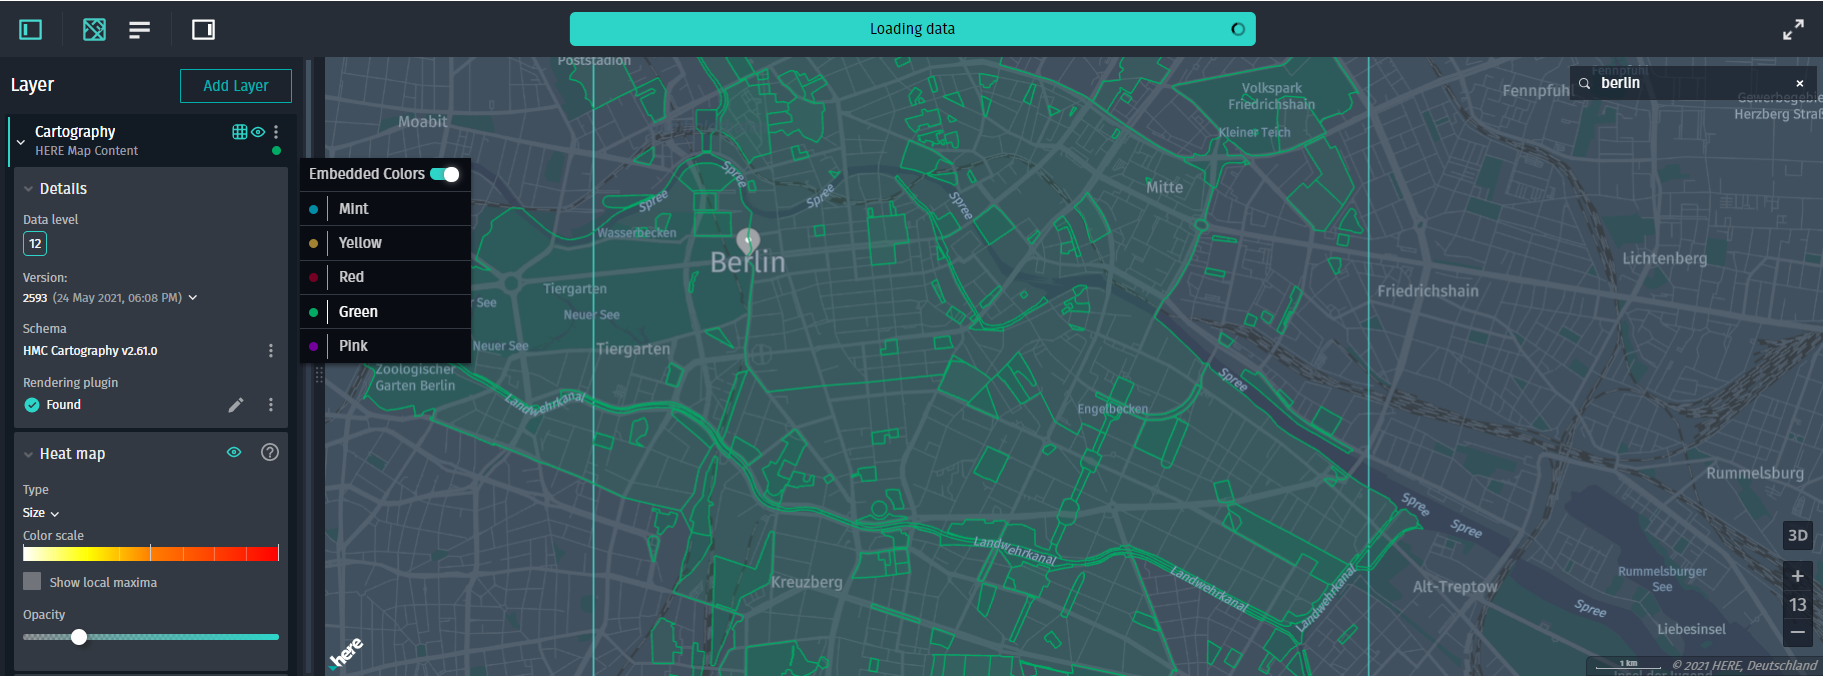
To display data using the colors defined in the rendering plugin, disable the Embedded Colors switch.
Compare different versions of the same layer
To compare different versions of the same layer:
- Add the same layer two or more times.
- In the Control Panel, select the desired version for each layer.
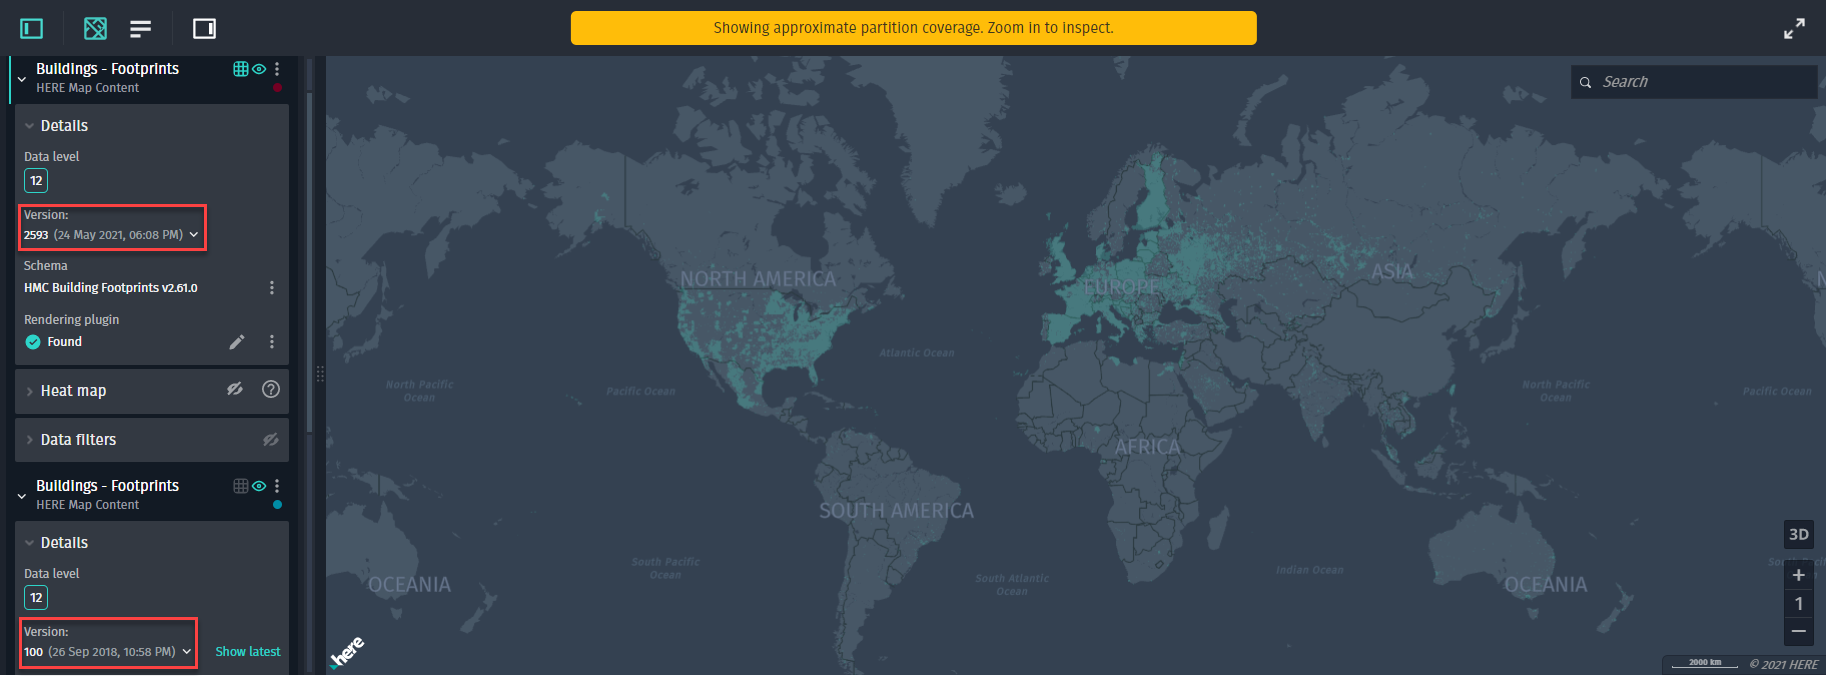
You can now inspect how the data has changed between different versions of the same layer.
Updated 7 months ago