Standard Grafana dashboards
A selection of Standard dashboards has been provided in Grafana for your convenience.
Grafana
The Grafana home page includes a list of available dashboards as shown in Figure 1. 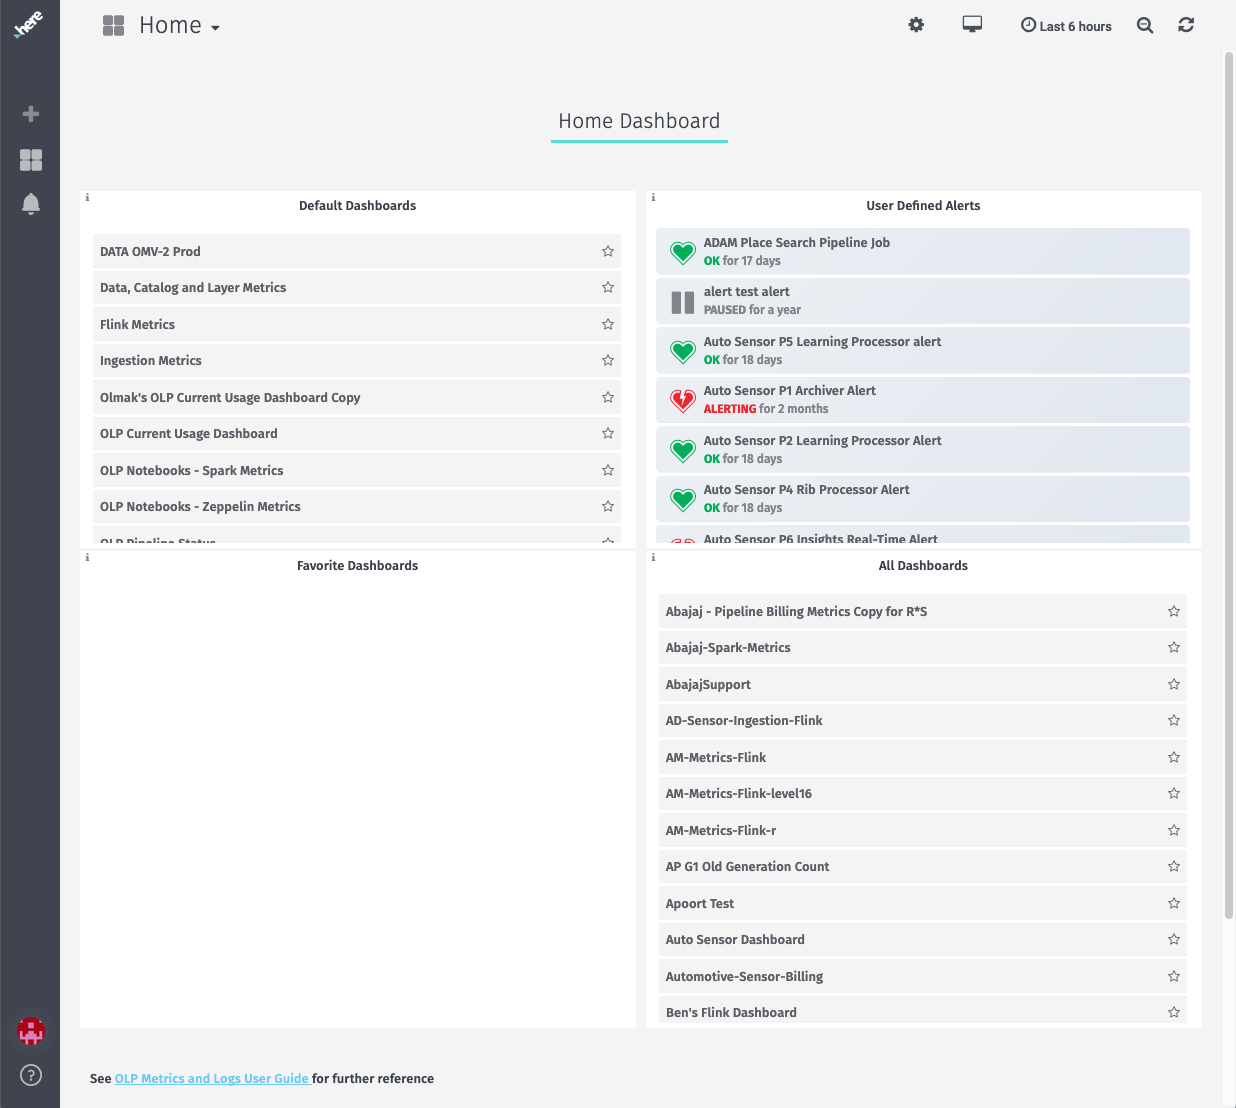 Default dashboards available for HERE Workspace include the following.
| Name | Description |
|---|---|
| Data, Catalog and Layer Metrics | A report of all catalog activity during the most recent 24 hours. |
| Ingestion Metrics | Reports on all data ingestion activities by catalog and layer. |
| HERE Workspace Current Usage Dashboard | Shows all current data resources and pipelines running in HERE Workspace. |
| Pipeline Status | A summary of pipeline jobs and their status. |
| Spark Metrics | Reports on Spark system usage metrics. |
| Flink Metrics | Reports on Flink system usage metrics. |
| HERE Notebooks - Spark Metrics | Reports on cluster metrics during process execution from within the HERE Notebook. |
| HERE Notebooks - Zeppelin Metrics | Reports on general metrics (excluding cluster metrics) during process execution from within the HERE Notebook. |
In Grafana, it is possible to copy the default dashboards or create new dashboards.
: Data Availability The data for metrics in Grafana is stored for last 30 days only. So, selecting time ranges greater than 30 days from Grafana will result in inaccurate metrics.