Performance tuning
Performance tuning
When you implement your compiler, there are some steps you can use to tune your
compiler's performance. This topic lists the potential bottlenecks according to
the processing order.
Hint Spark often overlaps the processes of different stages, so it is not
always easy to find out which stage is slowing down the processing. One way to
identify the stage with errors is to replace the code in the later stages with
empty stub implementations. For example, in RefTreeCompiler only
resolveFn, or resolveFn and compileInFn contain actual processing code.
Spark configuration
Spark provides a set of Spark properties to configure an application.
These can be set through Java system properties, as command line
arguments to spark-submit (though the --conf option) or hardcoded
when a SparkContext object is created.
The Data Processing Library provides a more convenient way to configure
Spark for a given batch processing application. You can add Spark
properties in the here.platform.data-processing.spark section of
application.conf:
here.platform.data-processing.spark {
  default.parallelism = 512
}
These settings are then used to construct a SparkContext.
Custom Kryo Registrator
For performance reasons, the Data Processing Library heavily uses the Kryo
serialization framework. This framework is used by Spark to serialize and
deserialize objects present in RDDs. This includes widely-used concepts such as
partition keys and metadata, but also custom types used by developers
identified with T in compilation patterns. In addition, in RDD-
based patterns, developers are free to introduce any custom type and declare
and use RDDs of such types.
The processing library is not aware of all the custom types used in an
application, but the Kryo framework needs this information. Therefore, you need
to provide a custom registrator that specializes the processing library's
KryoRegistrator to return a list of your classes and custom types which are
then registered automatically.
For example:
package com.mycompany.myproject

class MyKryoRegistrator extends com.here.platform.data.processing.spark.KryoRegistrator {

  override def userClasses: Seq[Class[_]] = Seq(
    classOf[MyClass1],
    classOf[MyClass2]
  )
}
The name of the class must be provided to the library configuration via
application.conf:
here.platform.data-processing.spark {
  kryo.registrationRequired = true
  kryo.registrator = "com.mycompany.myproject.MyKryoRegistrator"
}
Parallel calls to the Resolve function (RefTreeCompiler Only)
You can try to tune the number of parallel threads per executor. The default is
10, which means 10 threads operate in parallel.
If you notice that your machine is low on memory in this phase, or has very
high CPU utilization, you should reduce this number. If the CPU utilization is
low (<75%), your compiler is probably mostly waiting for network I/O, and
you can increase this number. The name of the configuration parameter is:
here.platform.data-processing.executors.reftree {
  // number of threads to use within one executor to run the resolve function
  parallelResolves = 10
}
It is safe to assume that the resolve function needs to retrieve the payloads,
because the content of a partition is normally used to gather its references.
Since payload retrieval is a blocking I/O operation, the resolve function
benefits from parallel execution, even within the same Spark worker node.
If parallel execution introduces too much CPU overhead, such as when the number
of times resolveFn needs to retrieve the payload of a partition is small
compared to the total number of partitions, set this parameter to 1 to disable
parallel execution.
Parallel Calls to the compileIn function (All Functional Compilers)
The most common performance impacting factor here is partitions being read
multiple times, for example when processing a tile requires you to load the
neighboring tile.
In such cases, you can increase performance in one of the following ways:
- Use a cache to load and decode tile objects, instead of relying on a
Retriever. Depending on the size of the partitions, even deserializing the
tiles multiple times might cause a high CPU load and garbage collection load.
This happens because tiles may contain many small objects. The basic pattern
consists of having an update function that uses aRetrieverto load a tile
and then decodes it, given theKeyandMetapair of the tile. Then, use a
cache object to extract the decoded tile from itsKeyandMetapair, using
the update function to fill the cache in case of a miss. - For large catalogs, the amount of memory may not be sufficient to cache all
partitions. In this case, you can improve the performance by using the
LocalityAwarePartitionerfor theinPartitioner. Use 2 to 5 levels above the
processed tile level, e.g. for input catalogs on level 14 this means level 9 to
12 could be good values. Typically, there is a tradeoff between better
locality (more global level, such as 9) and better distribution of the tile to
the Spark partitions (more detailed level, such as 12). If you use
LocalityAwarePartitioneryou should also try to set thesortingvariable in
the settings. - Here, there are two parameters in the configuration that you can tune. You
can configure the number of parallel threads, which is a trade-off for network
I/O delay with low number of threads vs. high CPU and memory usage for high
number of threads. Or, you can configure the sorting of the tiles within a
partition during compileIn: set to true if you useLocalityAwarePartitioner;
set to false if you useHashPartitioner.
here.platform.data-processing.executors.compilein {
  // number of threads to use within one executor to run the compileIn function
  threads = 10
  // sorting will make sure partitions with similar partition name are compiled together,
  // increasing cache hit ratio in many setups
  sorting = true
}
Spark parallelism
The number of Spark partitions each RDD consists of depends on the
partitioner used. The processing
library uses the inPartitioner and outPartitioner methods to
partition the RDDs passed to the compileIn and compileOut methods
respectively. For instance:
def inPartitioner(parallelism: Int): Option[Partitioner[InKey]] = {
  Some(LocalityAwarePartitioner(parallelism, 10))
}

def outPartitioner(parallelism: Int): Option[Partitioner[OutKey]] = {
  Some(HashPartitioner(parallelism))
}
The argument parallelism passed to inPartitioner and
outPartitioner is the value of the configuration parameter
here.platform.data-processing.spark.default.parallelism. If not
explicitly specified, this is equal to the number of cores on all
executor nodes. When processing large catalogs this number may be too
low, and may result in a small number of large Spark partitions. In
extreme cases, this results in an OutOfMemoryError.
In this case, you can increase the default parallelism by explicitly
setting a value in application.conf:
here.platform.data-processing.spark.default.parallelism = 512Alternatively, the default parallelism can be multiplied by a
coefficient in the partitioners' implementation:
def inPartitioner(parallelism: Int): Option[Partitioner[InKey]] = {
  Some(HashPartitioner(parallelism * 3))
}
You can use the above solution to set different parallelism values for
different tasks, different compilers of the same task, or to
independently fine-tune the parallelism used for compileIn and
compileOut.
Setting the parallelism value too high results in a large number of very
short Spark tasks, which adds noticeable overhead to the computation.
The probability that entries remain in the same Spark partition between
two stages, which reduces the shuffling of data, is proportional to the
inverse of the number of partitions. Furthermore, Spark tasks are
efficient as long as they last at least 200ms.
Shuffle between compileIn and compileOut (All compilers)
All of the data between compileIn and compileOut is stored in one RDD.
Passing a significant amount of data between such phases results in a large RDD
potentially shuffled around the cluster, because of the following:
- the partitioning changes from
inPartitionertooutPartitioner - the
Keys of the partitions change from input catalog to output
catalog.
You can mitigate this problem by:
- Passing less data. Sometimes processing can be distributed in a different
way, so that large data is created in thecompileOutphase only. - Using the same partitioner by extending
PartitionerNamePartitioner
(LocalityAwarePartitionerorNameHashPartitioner) asinPartitionerand
outPartitioner. This partitioner guarantees that partitions with the same name
will be kept on the same node, even if the catalog and layer IDs change. This
option can be helpful ifcompileInmainly generates data for the same tile in
the output catalog. - Changing the default RDD persistence strategy, as described
above. As this RDD can
be very large if lots of data is passed, nodes may run low on memory with the
MEMORY_ONLYandMEMORY_ONLY_ SERsettings. In this case, you could use
MEMORY_AND_DISK_SERinstead.
Parallel calls to the compileOut function (All functional compilers)
The same rules as
mentioned for compileIn apply.
The corresponding settings can be set independently:
here.platform.data-processing.executors.compilein {
  // number of threads to use within one executor to run the compileIn function
  threads = 10
  // sorting will make sure partitions with similar partition name are compiled together,
  // increasing cache hit ratio in many setups
  sorting = true
}
Tuning storage levels in Spark
All compiler executors create intermediate RDDs. If any of the RDDs is used
more than once, it is cached to avoid running the same operation multiple times.
Multiple classes of RDDs are persisted for the following reasons:
- RDDs obtained from querying Data API.
- RDDs obtained by uploading and publishing payloads to Metadata and Blob APIs.
- RDDs obtained by serializing and deserializing the internal state.
- General purpose RDDs, the default class.
You can set a Spark storage level for each of these classes. For a complete
list of possible values, refer to the Spark documentation.
The most useful storage level values are:
DISK_ONLY: Store the RDD partitions only on disk.MEMORY_ONLY: Store the RDDs as deserialized Java objects in the Java
Virtual Machine (JVM). If the RDD does not fit in memory, some partitions are
not cached and are recomputed on the fly each time they are needed.MEMORY_ONLY_SER: Store the RDDs as serialized Java objects (one byte array
per partition). Generally, this is more space-efficient than deserialized
objects, especially when you are using a fast serializer, but more CPU-
intensive to read.MEMORY_AND_DISK: Store RDD as deserialized Java objects in the JVM. If the
RDD does not fit in memory, the partitions that do not fit are stored on disk,
and read from there when needed.MEMORY_AND_DISK_SER: Same as the levels above, but each partition is
replicated on two cluster nodes.
Currently, such persisted RDDs are heavily used in gathering references, which
is an internal step in the RefTreeCompilerExecutor. The implementation in
RefTreeUtils.gatherReferences() is complex. During this operation, many RDDs
are generated and persisted. These RDDs belong to the default class.
To tune the performance impact of persisted RDDs, configure the parameters:
here.platform.data-processing.driver.sparkStorageLevels {
  default = "MEMORY_AND_DISK"
  catalogQueries = "MEMORY_AND_DISK_SER"
  publishedPayloads = "MEMORY_AND_DISK_SER"
  persistedState = "MEMORY_AND_DISK_SER"
}
For more details on valid values, see RDD Persistence
and Which Storage Level to Choose?
The following are possible solutions that may improve your compiler's performance:
- If you see lots of CPU and disk usage, but you seem to have some free memory
-- tryMEMORY_ONLYorMEMORY_ONLY_SER. - If you see that you are low on memory, but have high CPU utilization, you may
have run out of cache space -- tryMEMORY_AND_DISKorMEMORY_AND_DISK_SER. - If you use
MEMORY_ONLY_SERand your compiler runs low on memory -- try the
RDD compression property for serialized RDD partitions. By default, this
property is turned off in Spark. Enabling it can save substantial space at the cost
of higher CPU usage. You can enable it as follows:
  // Whether to compress serialized RDD partitions (e.g. for MEMORY_ONLY_SER)
  here.platform.data-processing.spark.rdd.compress = true
Inspecting the distribution of partitions among workers
The Spark Web UI provides a graphical representation of partitions distribution
across nodes. To view it, go to a stage in the UI and open the Event Timeline.
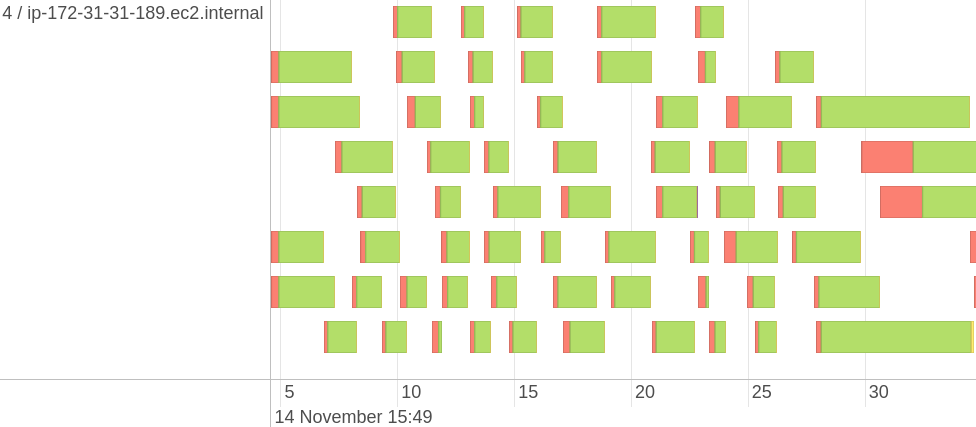
While you cannot directly see the distribution of partitions, but you can see
the timeline of tasks with different metrics, such as Task Deserialization Time
or Executor Computing Time of a task that can help to understand the
distribution of partitions. The image above shows the distribution for one
Executor, with the ID and IP address of the executor on its left. The console
shows you the distribution for all Executors simultaneously, so you can
visually estimate how even it is. There is no built-in instrument to get the
exact statistics. If you need to, you can parse the driver log and extract all
values associated with tasks timing.
By default, only the first 100 tasks are shown. Before making visualizations,
remember to display all pages with task related information. Otherwise not all
of the tasks will be included in your visualization.

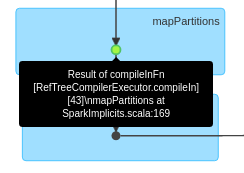
To analyze the partition distribution, you also need to find the stage at which
you need it. Typically, this is compileIn or compileOut. The RDDs in the
processing library are annotated with text that briefly describes which stage
this RDD belongs to. There is no universal rule how to find it on the DAG
visualization since there are multiple different compilers and each of them may
internally change from time to time, thus moving the desired stage to the left
of right in the list of all stages. An example of compileIn stage would look
like this:
Tuning partition distribution among workers
Since moving partitions of data among nodes is an expensive operation, Spark
tries to avoid it, keeping data as close as possible to the code that processes
it. This concept is referred to as data locality; see Spark documentation
for more information. This implies that if the data is not evenly distributed
at the beginning of a Spark job, it may happen that the computation is
performed on the nodes where the data actually is, thus preventing a fair load
distribution among the nodes available in a cluster.
How data locality affects data distribution among worker nodes can be
controlled via a set of Spark configuration parameters.
In particular, to favor load distribution over data locality developers can
make use of the here.platform.data-processing.spark.locality.wait
parameter as described in the following section.
Using spark.locality.wait
spark.locality.wait is part of the official Spark API. In a nutshell,
it defines how much time it takes until some part of data is given to an
executor non local to that data, when the local executor is busy. If you
set this parameter to a low value and the data, as described above, is
distributed very unevenly, Spark simply allows non local executors to
process it. If you specify
here.platform.data-processing.spark.locality.wait=0, then Spark does
not wait at all and tries to share the data to different executors
immediately.
Inspecting a specific Spark task
You can view the statistics for Spark tasks in the Spark web UI. This data
includes metrics such as task duration, task deserialization time, executor
computing time, and so on. You may want to associate some of these tasks with
input data. For example, if a task takes too long to compile and you need to
find out what data was compiled there. You can use the TaskContext
API from Spark to find out. This API provides information about the current
stage, current task, and so on, and is accessible from a lambda function. Using
the API, you can, for example, log the ID of Spark task and the keys that you
process.
One limitation for functional compilers in the Data Processing Library, within
Spark's TaskContext
API, is that it can only be used if the number of parallel calls to both the
compileIn functions and the compileOut functions is set to 1. The
TaskContext is not available for larger numbers of parallel calls.