How to visualize 3D data
The Data Inspector allows visualizing 3D data - any GeoJSON data, including the data produced by a rendering plugin, that contains an altitude property in meters above the ground, like building height, HD lanes elevation, ADAS elevation, or 5G pole heights.
3D mode
To enable the 3D mode, click the 3D button in the bottom-right corner of the Map View. As a result, the map tilts to a 45° angle for a better overview of extruded map features. 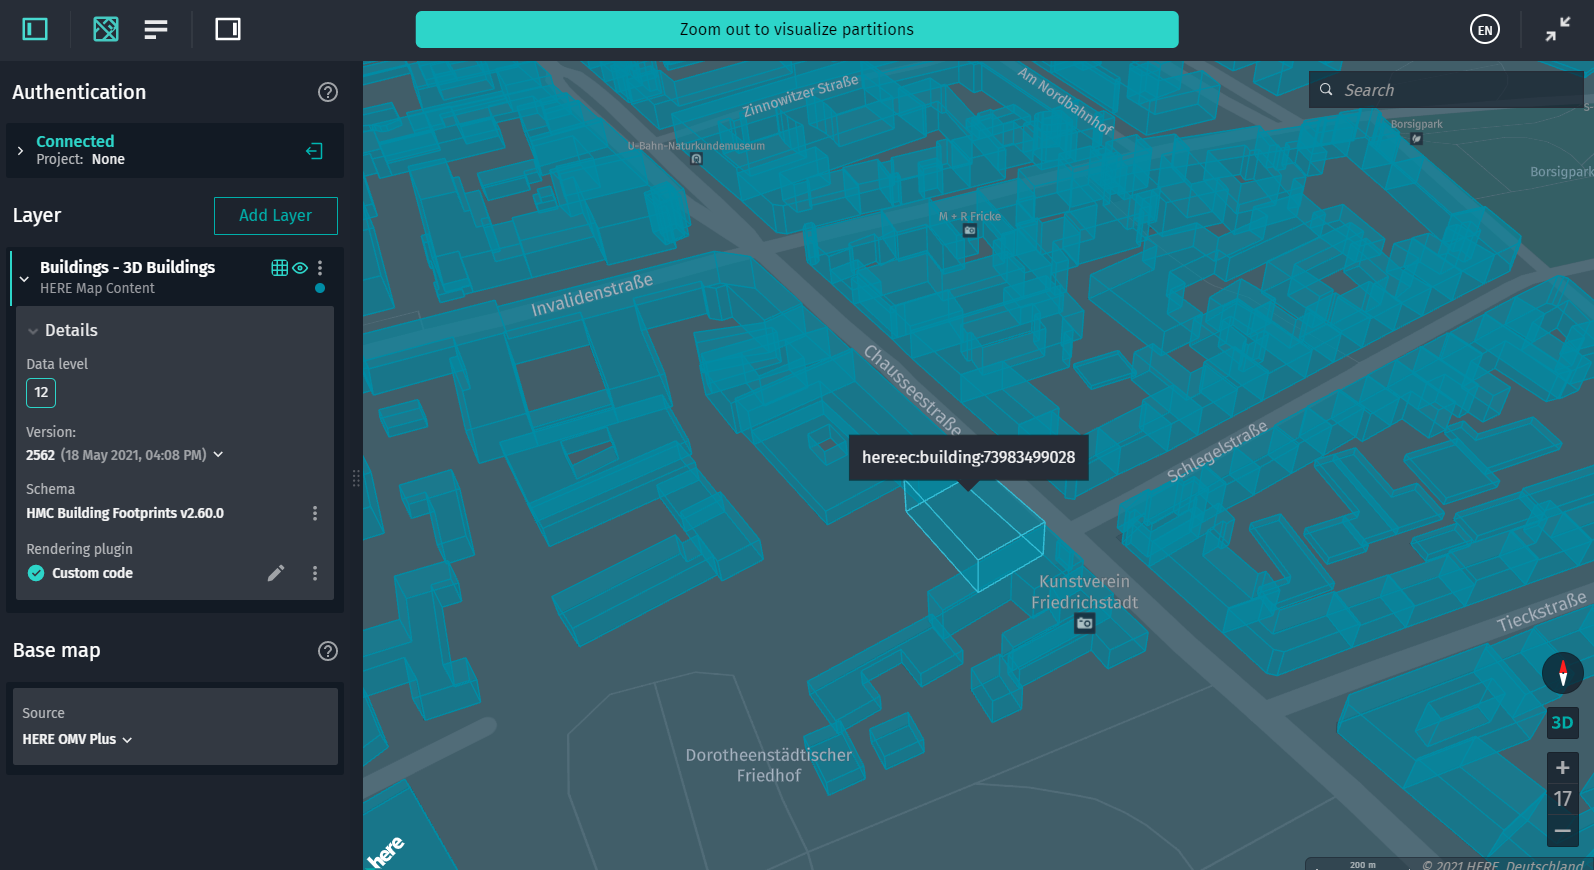 To switch back to the flat 2D mode, click the 3D button again.
:
For backward compatibility, in 2D mode, 3D data is rendered as if altitude were set to 0. This helps users who don't want to use altitude in visualization still keep it in their data.
Map tilt and rotation
Right-click and hold the mouse to tilt and rotate the map as needed.
For geographic orientation, observe the compass icon that indicates the change of cardinal directions in real time. 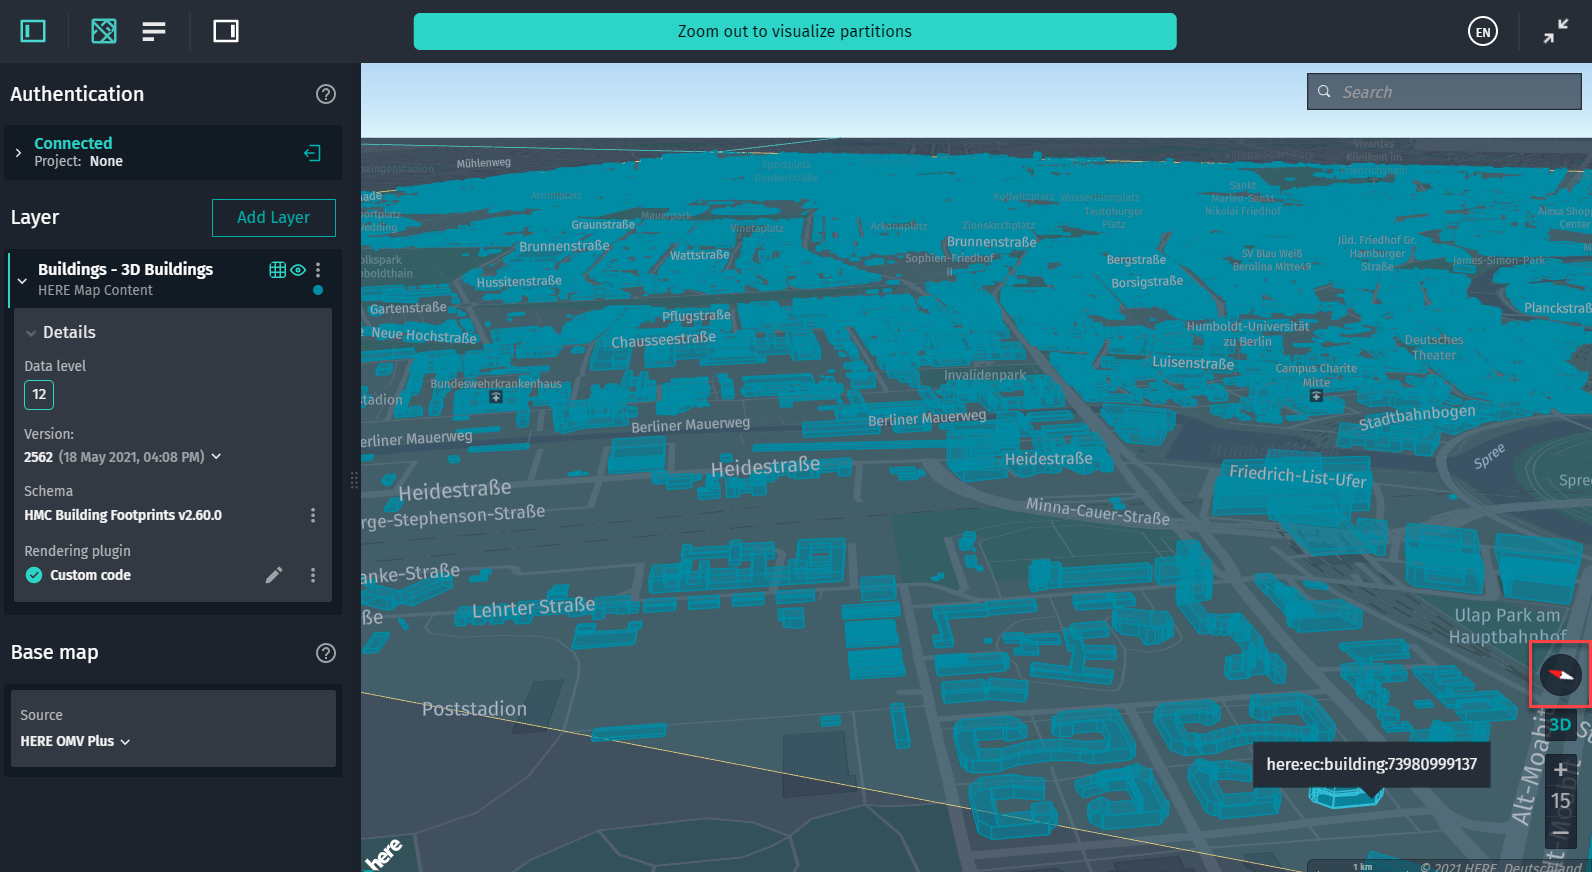 Changelog API reference