Introduction to Logs, Monitoring, and Alerts
HERE Workspace generates operational logs and metrics that you can use to keep track of your processes and usage. You can also configure certain conditions to trigger notifications from both your catalogs and pipelines, and you can log your own messages from within your pipelines. 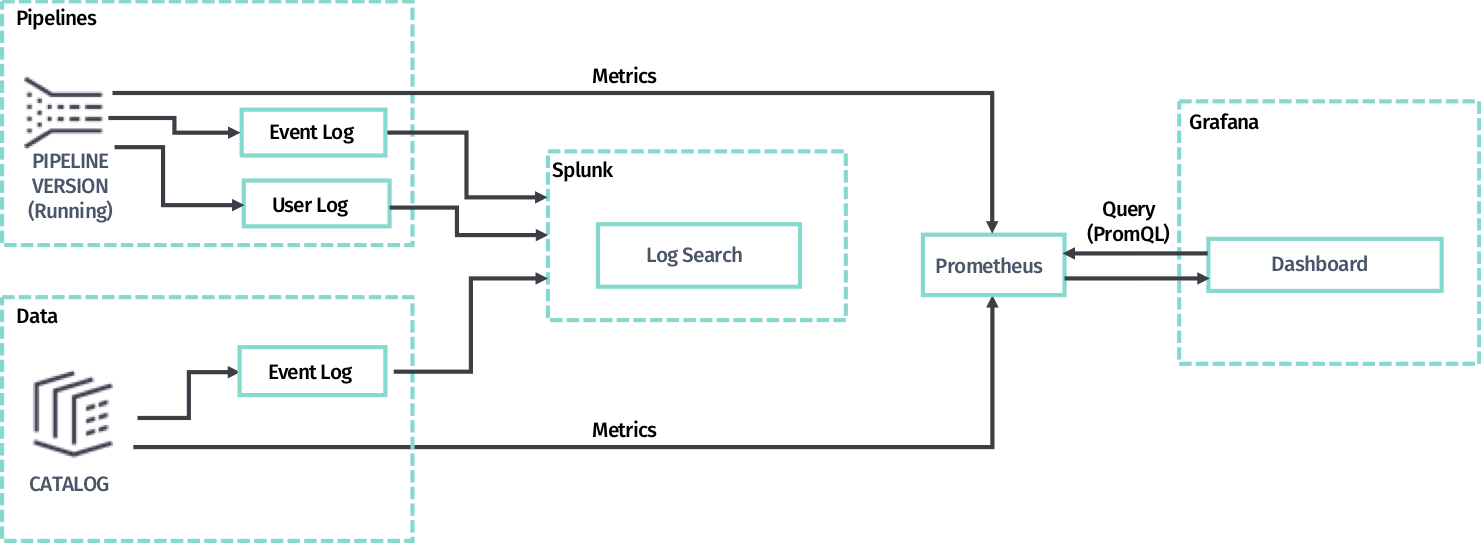 There are three tools involved in logging and metrics:
- Splunk - Use this tool for viewing and searching logs.
: Splunk Usage Limitations HERE is offering Splunk as a tool to search and display logs from applications running on the HERE platform. As a customer, you must only use Splunk for on-platform purposes. It’s not allowed to ingest log data from outside the HERE platform into the HERE platform Splunk.
- Grafana - Use this tool for viewing metric data on dashboards. HERE Workspace comes with standard regional dashboards and you can also create your own custom dashboards and alerts.
- Prometheus - A data collection agent that stores metrics pushed from the pipeline and data services, saving it in a time-series database that can then be used by Grafana dashboards.
: Prometheus database Prometheus only retains data from the previous 30 days. This means that Grafana will not be able to access data over 30 days old.
Regions
The Splunk tool is global, meaning that the logs coming from all regions will be shown in the results.
However, there is one Grafana per region. Metrics displayed on those dashboards will belong only to that region. This applies to multiregion catalogs as well. In order to monitor all regions of a multiregion catalog, dashboards will need to be manually duplicated accross all Grafana regions.
Official documentation
For documentation regarding Grafana, see the official Grafana Documentation v8.3.
For documentation regarding Prometheus, see the official Prometheus Documentation.