How to run a Flink application on the platform
How to run a Flink application on the platform
Objectives: Run a simple Flink application on the platform and monitor the application execution.
Complexity: Beginner
Time to complete: 40 min
Prerequisites: Develop a Flink application, Organize your work in projects
This tutorial demonstrates how to run a Flink application developed in
the Develop a Flink application tutorial on the platform. It shows how
to get information about the execution of the application using Grafana, Splunk, Flink UI, and Platform Billing Page.
The tutorial covers the following topics:
- Configure resources on the platform
- Run a Flink application on the platform
- View the execution plan using Flink UI
- Get application logs from Splunk
- Monitor application data using Grafana Dashboard
- Get costs of the execution
Configure resources on the platform
You will run the application in a project. A project is a container for the HERE platform resources you use to build an
app, service, or other work product. It can contain resources such as catalogs, pipelines, schemas, and services. The
project controls which users, apps, and groups can access the resources in the project. We recommend that you use
projects to manage all your platform resources. For more information about projects, see
the Manage Projects
documentation.
Let's create a project using the OLP CLI:
olp project create $PROJECT_ID $PROJECT_NAMEThe OLP CLI should return the following message:
Project $YOUR_PROJECT_HRN has been created.Save the $YOUR_PROJECT_HRN value to the console variable to simplify command running.
The next step is to create the input streaming catalog in the project we have created before. The --scope parameter is
used to specify the project for OLP CLI.
Let's execute the following command to create the catalog using exactly the same catalog-with-stream-layer.json config
file as we have used in the Develop Flink application tutorial:
olp catalog create <catalog-id> <catalog-name> --config catalog-with-stream-layer.json --scope YOUR_PROJECT_HRNThe OLP CLI should return the following message:
Catalog YOUR_CATALOG_HRN has been created.
NoteIf a billing tag is required in your realm, update the config file by adding the
billingTags: ["YOUR_BILLING_TAG"]property to thelayersection.
The next step is to configure the source code to use the catalog we have created before. Replace the INPUT_CATALOG_HRN and OUTPUT_CATALOG_HRN
placeholders in the pipeline-config.conf file.
The application has to be packaged with all dependencies in a Fat JAR to be deployed on the platform. The Java/Scala SDK
provides a platform profile to generate the Fat JAR. The following command uses the profile to generate the Fat JAR.
mvn -Pplatform clean packageThe develop-flink-application-<tutorial-version>-platform.jar Fat JAR should be created in the target folder.
Run a Flink application on the platform
To run the Flink application on the platform, you need to get familiar with the Pipeline API.
The following image demonstrates the full pipeline deployment flow using the OLP CLI.
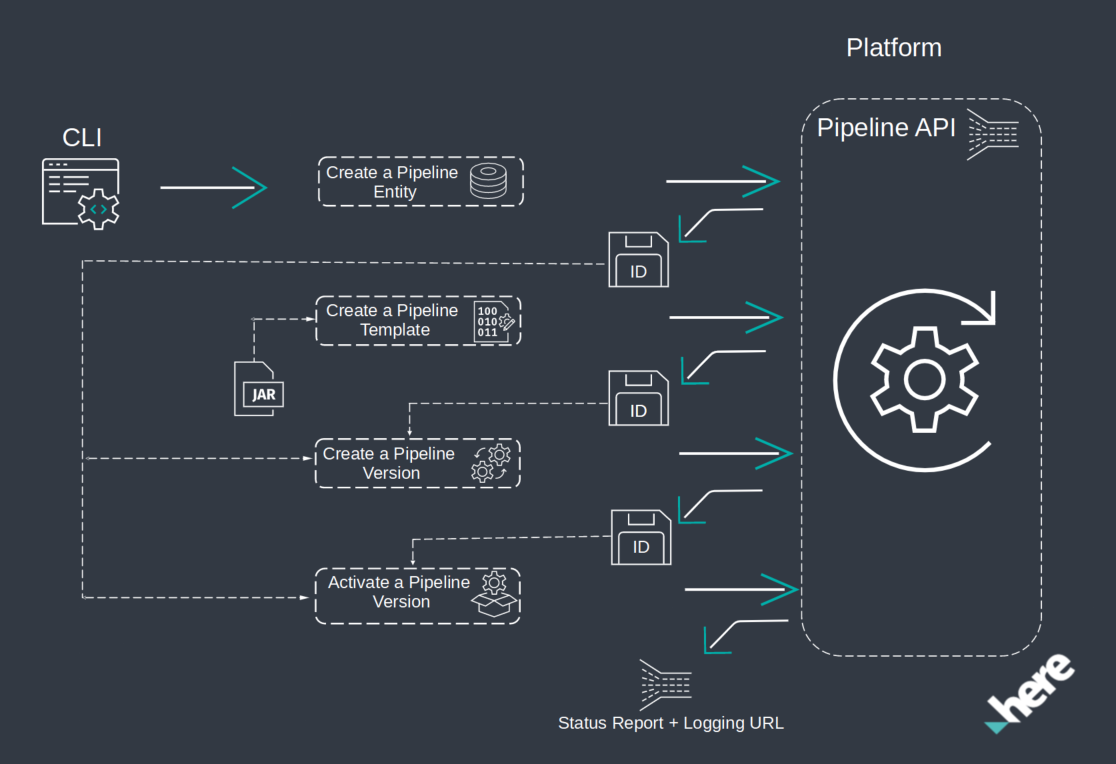
For more information about pipelines, see
the Pipelines Developer's Guide.
Now you have all the resources used by the application, and the application configured to use them and prepared to be
deployed on the platform. Let's launch the application.
Let's create a pipeline in the project scope using the following OPL CLI command:
olp pipeline create $PIPELINE_ID --email $EMAIL --scope $YOUR_PROJECT_HRNThe OLP CLI should return the following message:
Pipeline $YOUR_PIPELINE_ID has been created.The next step is to create a pipeline template. Pipeline templates are provided to aid the user with creating pipelines.
These templates contain reusable pipeline definitions - the implementation, as well as the input and output catalog
schemas.
Let's understand what parameters are needed to create a pipeline template.
You need to specify the template name and stream runtime environment, since in this tutorial we run a Flink application and use the stream environment on the platform.
The next parameters are the Fat JAR created by the mvn package -Dplatform command and the name of the main class.
Next, input catalog IDs should be specified that are expected in the pipeline version configuration.
The last parameter is the project HRN, as we create all the resources in the project.
Let's create a pipeline template using the following OLP CLI command:
olp pipeline template create $TEMPLATE_NAME \
stream-7.0 target/develop-flink-application-<version>-platform.jar \
DevelopFlinkApplication --input-catalog-ids \
pipeline-config.conf --scope $YOUR_PROJECT_HRN
olp pipeline template create $TEMPLATE_NAME \
stream-7.0 target/develop-flink-application-<version>-platform.jar \
DevelopFlinkApplicationScala --input-catalog-ids \
pipeline-config.conf --scope $YOUR_PROJECT_HRNThe OLP CLI should return the following message:
Pipeline template $YOUR_PIPELINE_TEMPLATE_ID has been created.The next step is to create a pipeline version. Within the Pipelines API, a version of the pipeline is a form of a
pipeline and pipeline template.
Let's create a pipeline version in the project scope with the develop-flink billing tag on which you can get billing
and usage which was produced in the pipeline in the Billing and Usage chapter using the following
OLP CLI command:
olp pipeline version create test-flink-version $YOUR_PIPELINE_ID $YOUR_PIPELINE_TEMPLATE_ID pipeline-config.conf --billing-tag develop-flink --scope $YOUR_PROJECT_HRNThe OLP CLI should return the following message:
Pipeline $YOUR_PIPELINE_ID has been created.Once you have created the pipeline, pipeline template and pipeline version, you can run the application on the platform by activating the pipeline version with the following command:
olp pipeline version activate $YOUR_PIPELINE_ID $PIPELINE_VERSION_ID --scope $YOUR_PROJECT_HRNThe OLP CLI should return the following message:
Pipeline version $YOUR_PIPELINE_ID has been activated.After this command is executed, the pipeline is started on the platform. You can check the current state of the pipeline
on the Pipeline page or using the following OLP CLI command:
olp pipeline version show $YOUR_PIPELINE_ID $PIPELINE_VERSION_ID --scope $YOUR_PROJECT_HRNThe OLP CLI should return the information about the specified pipeline version, including its configuration, logging URL, pipeline UI URL.
logging URL is the url to the Splunk logs and pipeline UI URL is the URL to the Flink UI. Remember the logging and pipeline UI URLs to use in the next chapters.
Details of the $YOUR_PIPELINE_ID pipeline:
ID                       21b73602-325c-4379-b7f7-0757fcada214
version number           1
pipeline template ID     b6b8ac6e-9180-4ab4-ba4f-a371606d7785
output catalog HRN       $YOUR_CATALOG_HRN
state                    running
created                  2022-02-18T09:28:04.767735Z
updated                  2022-02-18T09:29:33.611167Z
highAvailability         false
multi-region enabled     false
input catalogs
    ID                            HRN
    $YOUR_CATALOG_ID     $YOUR_CATALOG_HRN
logging URL              https://splunk.metrics.platform.here.com/en-US/app/olp-here-test/search?q=search%20index%3Dolp-here-test_common%20namespace%3Dolp-here-test-j-8a1763f4-3356-4bee-8001-a5642bbf30d7
pipeline UI URL          https://eu-west-1.pipelines.platform.here.com/jobs/8a1763f4-3356-4bee-8001-a5642bbf30d7/ui
schedule                 none
The application is up and running on the platform. Let's check the execution plan and logs and configure monitoring for
your application.
View the execution plan using Flink UI
Flink features a web UI to inspect, monitor, and debug running applications.
Once you have a running pipeline, you can access the Flink UI. Use the pipeline UI URL from the results
of olp pipeline version show
command from the previous chapter.
You can use your application's Apache Flink Dashboard to monitor your streaming application's health.
Your application's dashboard shows the following information:
- Resources in use, including Task Managers and Task Slots.
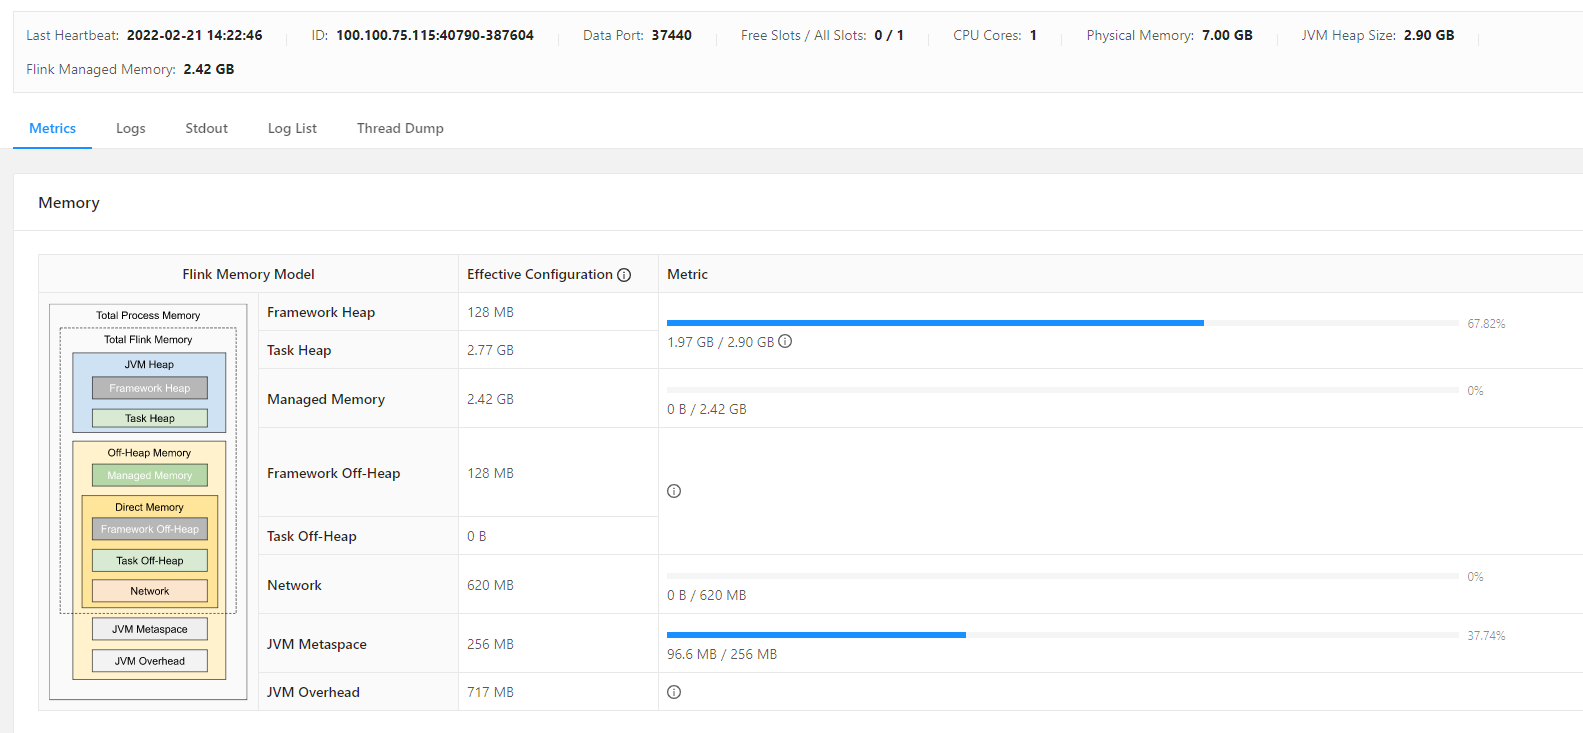
- Information about Jobs, including those that are running, completed, canceled, and failed.
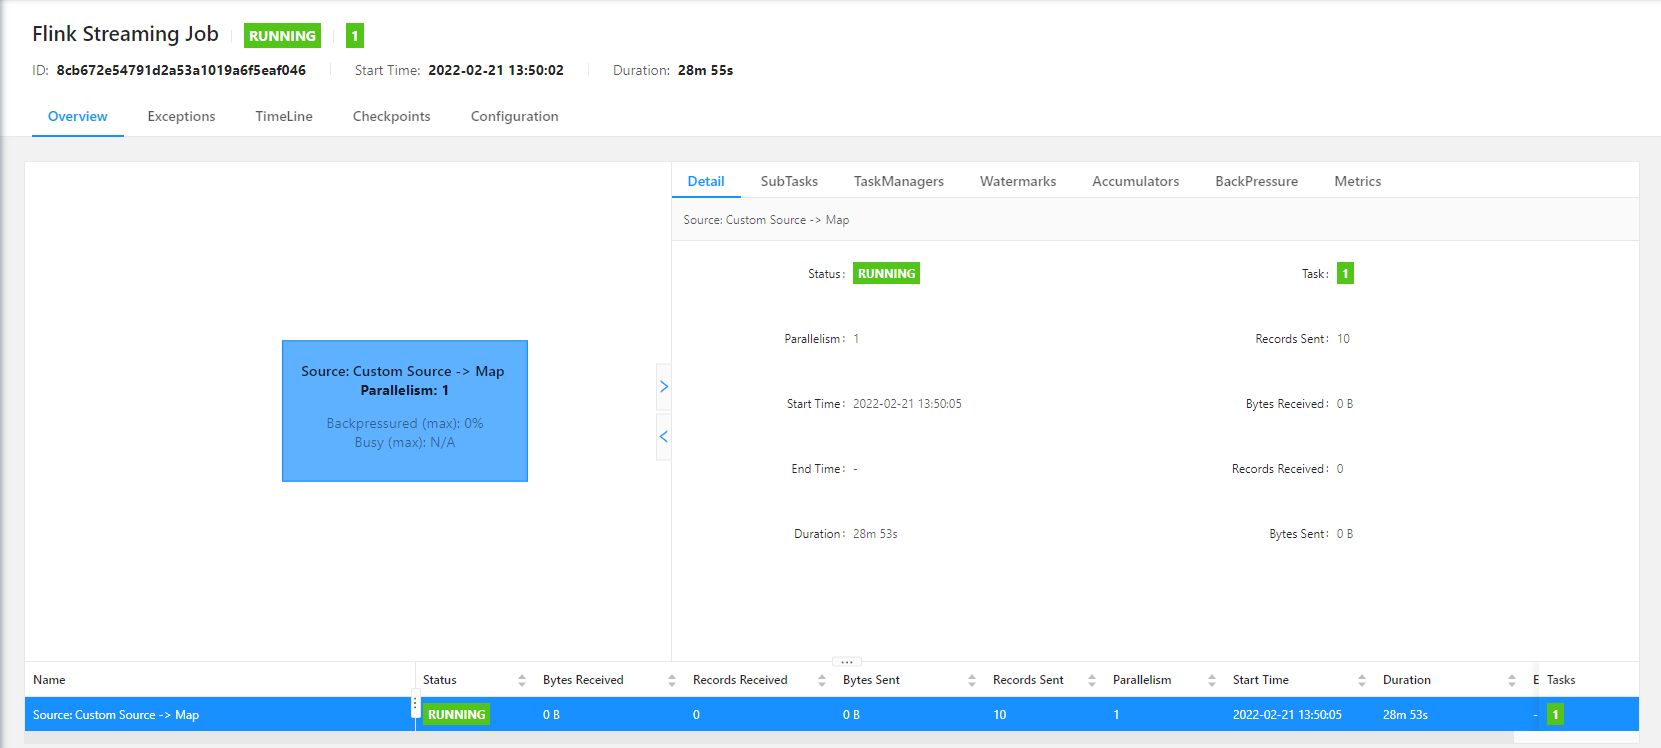
In the images above, you can find information about application execution, particularly, application status, duration of
execution, task count, thread count, and information about Flink Memory Model, such as physical memory, JVM heap size,
task heap size and so on.
For information about Apache Flink Task Managers, Task Slots, and Jobs,
see Apache Flink Architecture
on the Apache Flink website.
Get application logs from Splunk
Splunk is a software platform to search, analyze and visualize machine-generated data gathered from the websites,
applications, sensors, devices, and other sources, which make up your IT infrastructure and business. For information on how to use
Splunk, see the Splunk Enterprise User Documentation.
On the HERE platform, the Logging Level is set for a Pipeline Version. All the Jobs use the logging level associated with the corresponding
Pipeline Version. Logging Levels can be set at the root level for the entire pipeline and/or as an individual logging
level for a specified class. By default, error and warn log entries are sent to Splunk for review. How much information
is reported in the logs depends on the logging level you select for each pipeline version when it is executed. Due to
operational latency, it takes a few minutes for the changes to take effect. This may delay the availability of the logs
at the new level in Splunk.
To check the current log level for your pipeline version, run the following OLP CLI command:
olp pipeline version log level get $YOUR_PIPELINE_ID $YOUR_PIPELINE_VERSION_ID --scope $YOUR_PROJECT_HRNThe OLP CLI should return the following message:
Current logging configuration
root         warn
From the result output, you can see that the default log level is warn. This means that the Splunk will not display
logs from our application because we log all the data using the Logger.info() method from the log4j library. In order for the Splunk to
display our logs, it is necessary to set the log level to info.
The OLP CLI provides
the olp pipeline version log level set
command to set up logging for the pipeline version:
olp pipeline version log level set $YOUR_PIPELINE_ID $YOUR_PIPELINE_VERSION_ID --root info --scope $YOUR_PROJECT_HRNThe OLP CLI should return the following message:
Current logging configuration
root      info
For more information on how to configure logging in your application, see
the Pipelines Developer Guide
to get .
So far, the application has not sent any logs to Splunk. The application sends logs only when it processes data from
the input catalog. Let's send some data by running the following script that uploads data with the First HERE Platform Flink Application content
to the stream layer 10 times every 5 seconds:
#!/usr/bin/env bash

# Copyright (c) 2018-2026 HERE Europe B.V.
#
# Licensed under the Apache License, Version 2.0 (the "License");
# you may not use this file except in compliance with the License.
# You may obtain a copy of the License at
#
#     http://www.apache.org/licenses/LICENSE-2.0
#
# Unless required by applicable law or agreed to in writing, software
# distributed under the License is distributed on an "AS IS" BASIS,
# WITHOUT WARRANTIES OR CONDITIONS OF ANY KIND, either express or implied.
# See the License for the specific language governing permissions and
# limitations under the License.


# catalog hrn with stream layer
CATALOG_HRN=$1
# project hrn
PROJECT_SCOPE=$2
# folder with data that is uploaded to the stream layer
FOLDER_WITH_DATA="./src/main/resources/data"


# Upload data to the stream layer 10 times every 5 seconds
for i in {1..10}
do
  olp catalog layer stream put ${CATALOG_HRN} streaming-layer --input "${FOLDER_WITH_DATA}" --scope ${PROJECT_SCOPE}
  sleep 5
done
Execute the following command to run the script:
bash scripts/populate-streaming-data-platform.sh $YOUR_CATALOG_HRN $YOUR_PROJECT_HRNEach running Pipeline Version has a unique URL where the logs for that pipeline are stored. When using the CLI, the log
URL information is supplied by the pipeline whenever a pipeline version is activated, upgraded, or when a status request
is submitted.
Use the logging URL from the previous chapter to reach the Splunk UI.
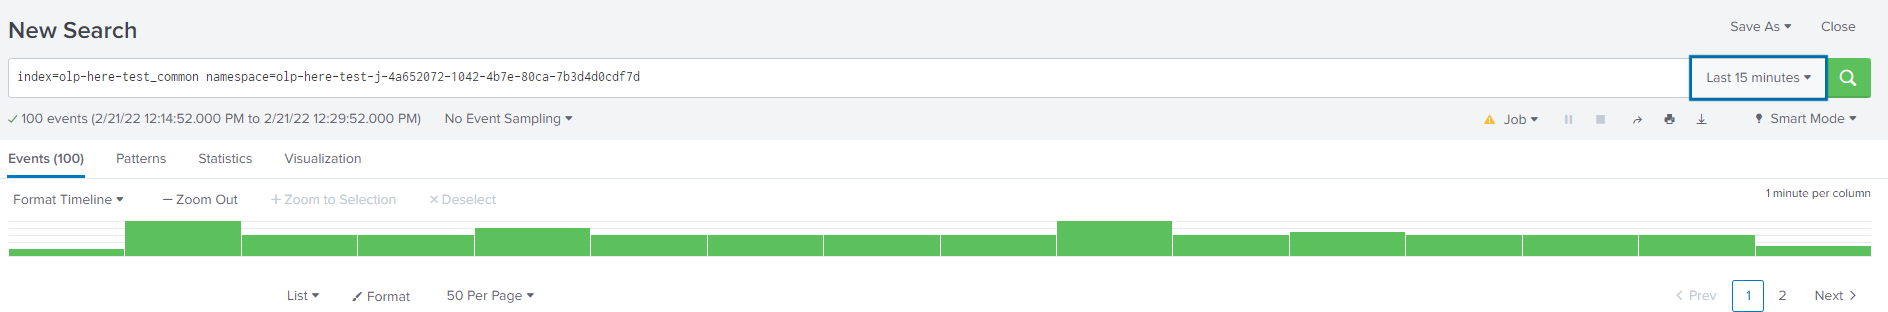
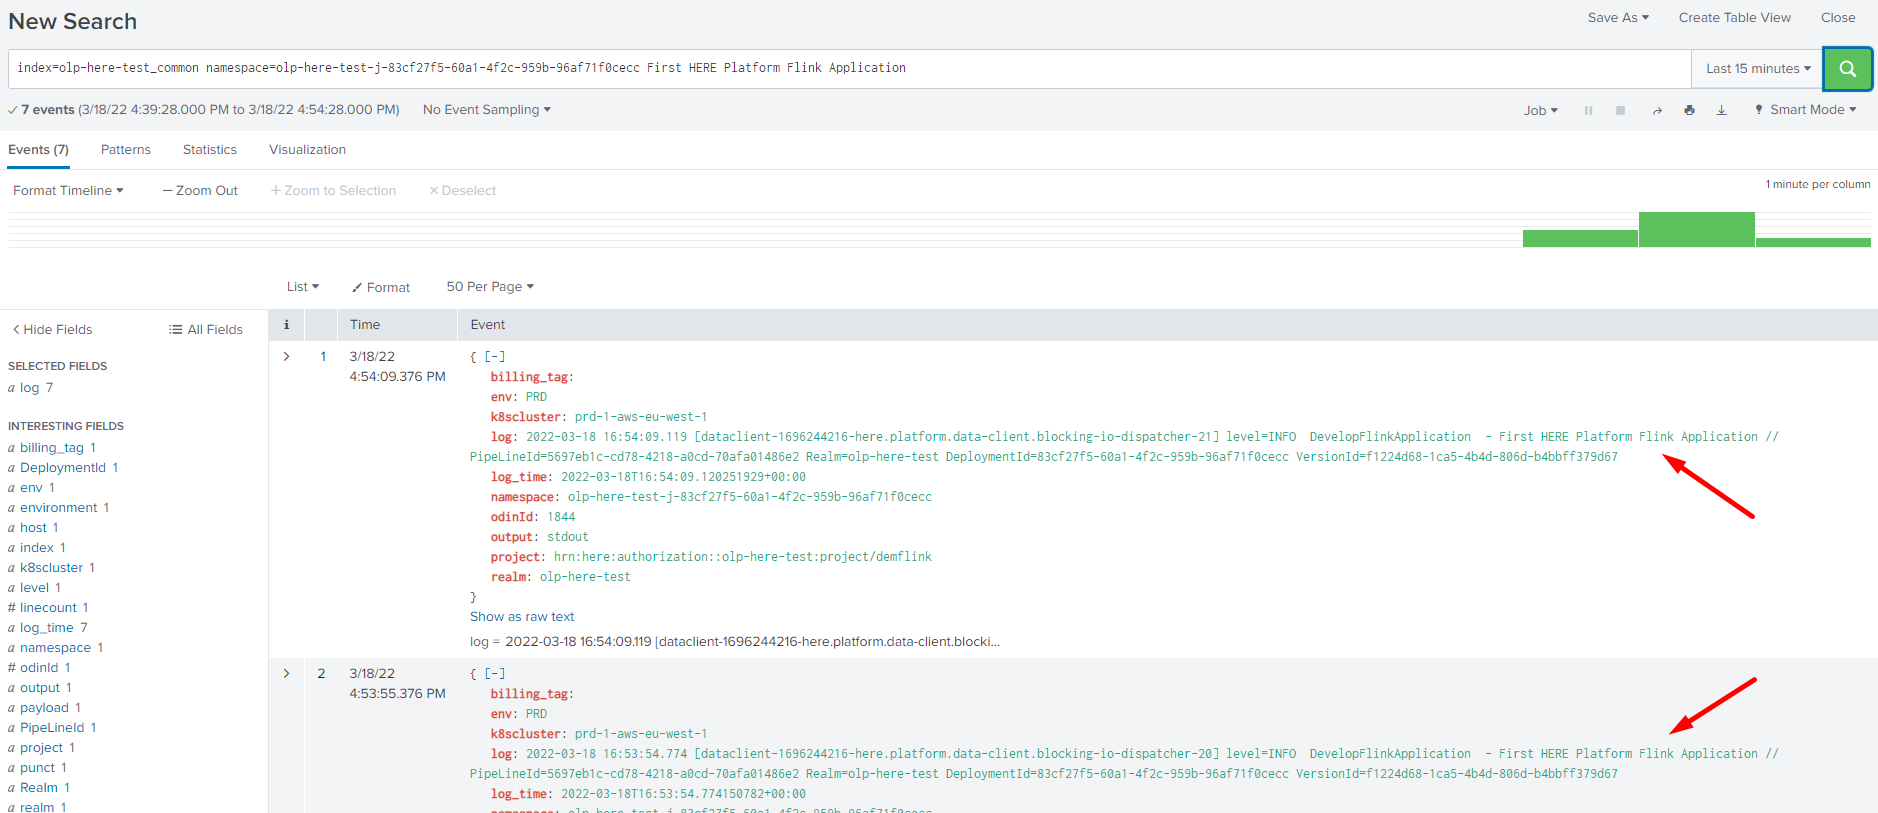
If you need to find some specific logs in the Splunk, you can add a filter as the last parameter in the Search line.
Pipeline logs are stored in the olp-<realm>_common index. For example, if your account is in the olp-here realm,
your index would be olp-here_common.
From the picture below you can see that in the Search line the index is specified, the namespace is generated by the
pipeline version, and the last First HERE Platform Flink Application parameter is just a filter by which we want to find data uploaded to the catalog before.
For more information on how to get logs from Splunk, see
the Search Application Logs
page.
This way, you can set up logging for your application to get information that was produced by your application using
Splunk UI.
Monitor application data using Grafana Dashboard
Now that the application is running on the platform and you have verified that it is working correctly with Flink UI and
Splunk, the next step is to set up monitoring.
Grafana is a complete observability stack that allows you to
monitor and analyze metrics, logs and traces. It allows you to query, visualize, alert on and understand your data no
matter where it is stored.
There is one Grafana per region. Metrics displayed on dashboards will belong only to that region. That's why the
platform provides Primary and Secondary Regions Monitoring pages.
This tutorial runs on the Primary region and shows the instructions for Primary Region Grafana only.
This tutorial demonstrates how to monitor your application execution, or rather check the pipeline status using the
existing Grafana Dashboard, create your own Grafana Dashboard that monitors the count of the running jobs and Grafana
alert which sends an alert to you by email when no jobs are running.
To monitor the status of a pipeline, a Pipeline Status dashboard is available in Grafana.
Go to the platform portal, open the Launcher menu and select Primary Region Monitoring
. This takes you to the Grafana home page.
The home page allows access to several dashboards. Several Default Dashboards are listed on the left side of the page.
From the list of default dashboards, locate the OLP Pipeline Status dashboard. Click on the dashboard name to open it.
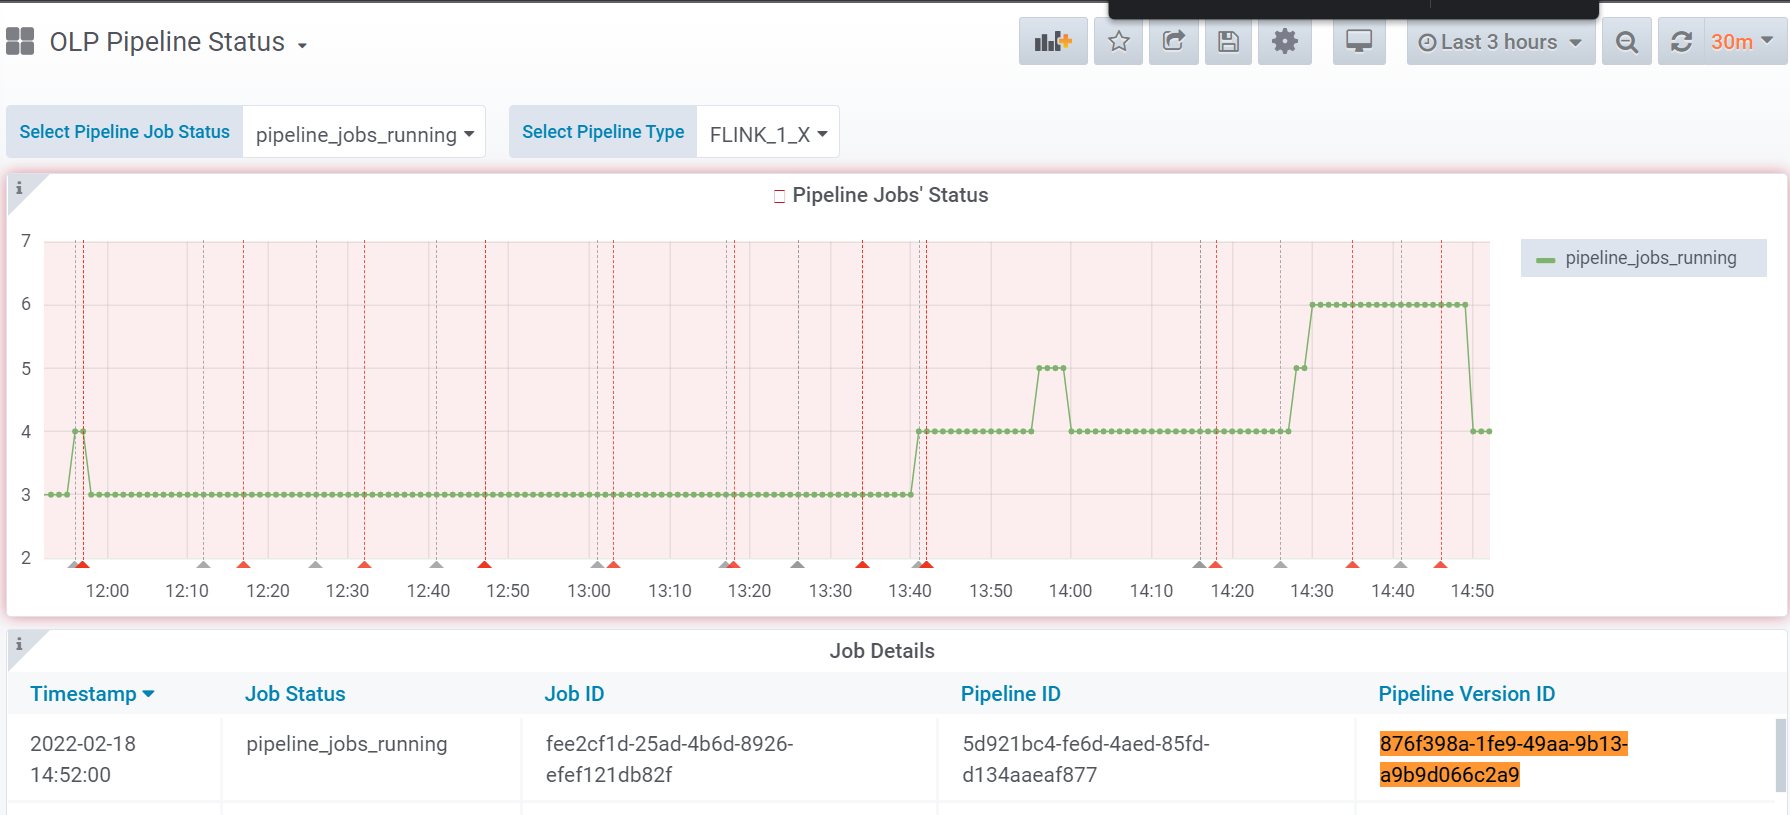
The OLP Pipeline Status dashboard shows the current state of all pipelines in the realm. You can find your pipeline
version in the list of all pipelines that are running if you select the Flink_1_X pipeline type and
the pipelines_jobs_runnings job status.
The picture below shows the number of running job for the specified pipeline version that are currently running:
The platform allows not only to use the existing Grafana dashboards but also to create your own.
NoteIf you want to create your own Grafana Dashboard and configure some specific metric query, you need to get
Dashboards monitorrole.
This role can be granted by any user that has theOrgAdminrole on the platform.
To create your own Grafana dashboard, follow the steps below:
- Click
Create>Dashboard - Select
Add Queryand configure you query. - Add the
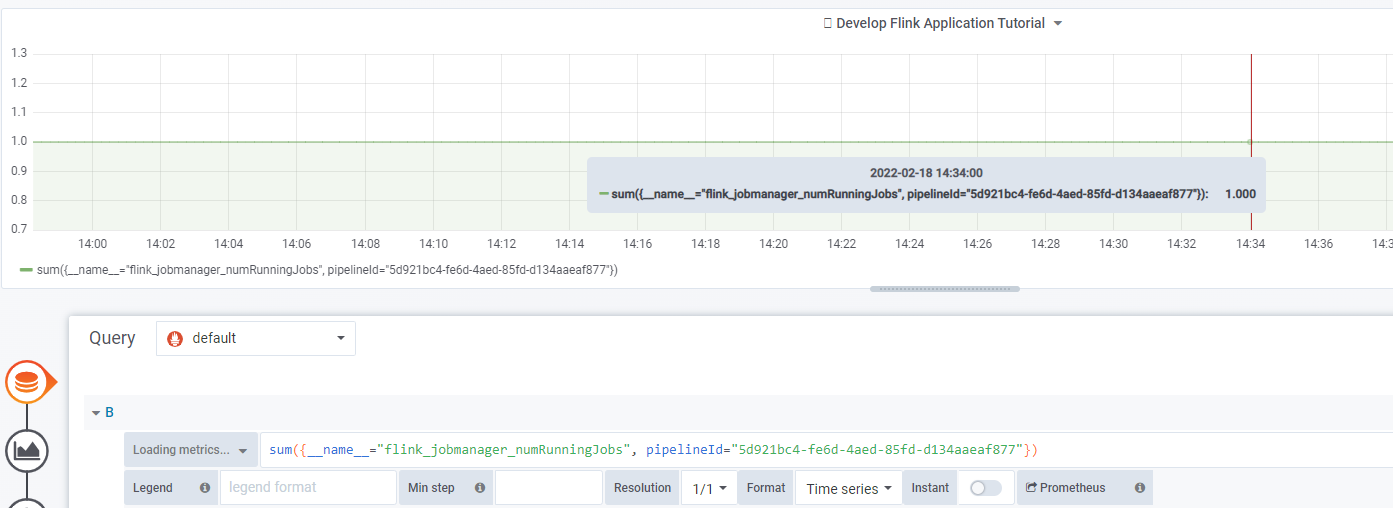
sum({__name__="flink_jobmanager_numRunningJobs", pipelineId="YOUR_PIPELINE_ID"})query to monitor the count
of the running jobs. In the query above, the__name__parameter is set toflink_jobmanager_numRunningJobs. It
means that Grafana dashboard will show the total number of running jobs for the pipeline specified in thepipelineId
field.
As a result you get a Grafana Dashboard that shows the number of running job for the specified pipeline ID that are currently running:
For more information on how to configure Grafana queries to monitor Flink applications, see
the Logs, Monitoring and Alerts
User Guide.
The next step is to create an Alert to monitor that there are running jobs for the pipeline. Grafana lets you set up
alerts and request email notifications when a condition or threshold is met.
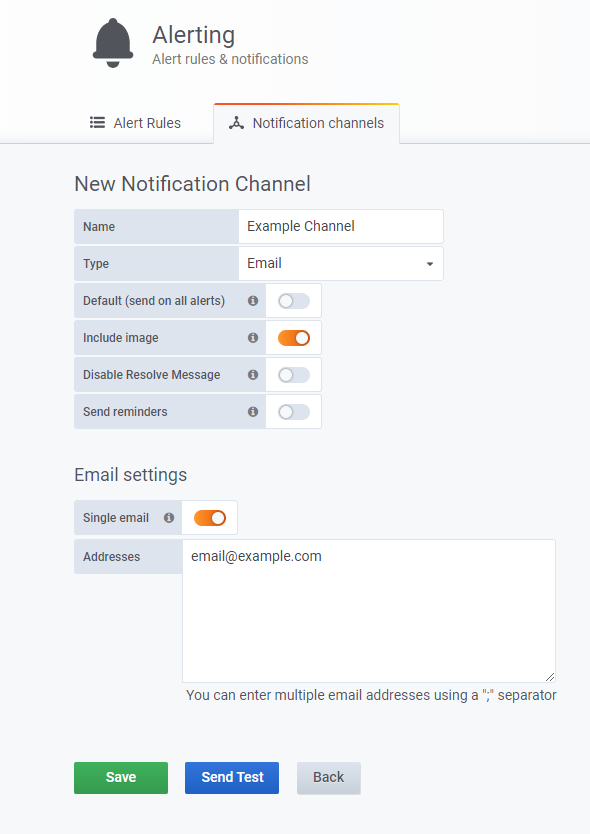
Firstly you need to create a notification channel using the following steps:
- In Grafana, click the dropdown menu in the upper left, select
Alerting>Notification Channels>New channel. - Specify the channel name
Example Channel, selectemailin the type field and specify your email addresses[email protected]in theEmail settings
chapter:
For more details and options, see
the Grafana Documentation on Notifications
.
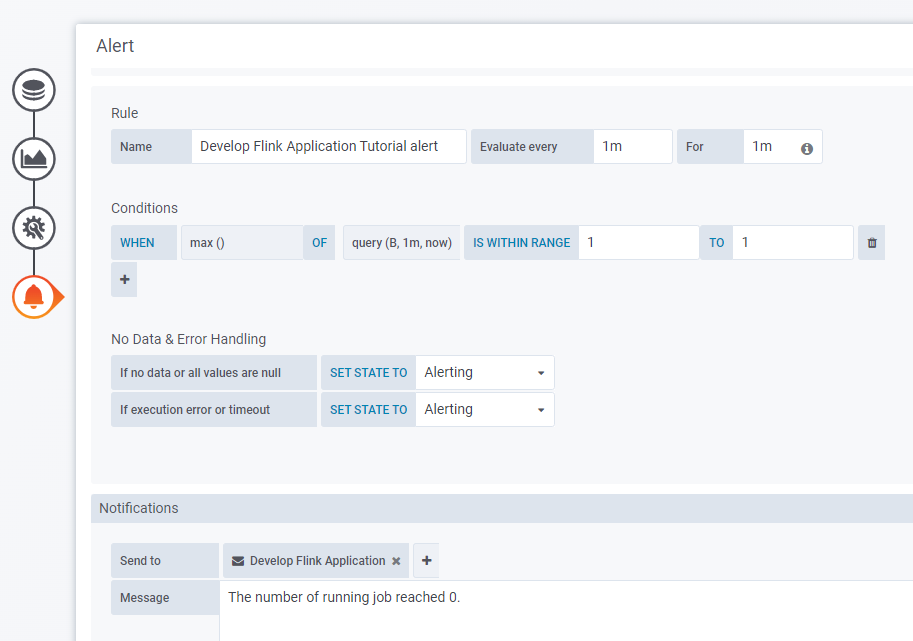
To create an alert, follow the steps below:
- Edit the Grafana Dashboard created as described above by clicking on the
Panel Titleand choosingEdit. - Select the
Alerttab to add values to the alert. - Specify the rule name in the
Namefield. In the example theNameisDevelop Flink Application Tutorial alert. - Specify the frequency with which the rules should be checked in the
Evaluate every:1mandFor:1minutes. - Specify the conditions according to which the rules will be checked in the
Conditionschapter.
In the example, theconditionisWHEN max() OF query(B, 1m,now) IS WITHIN RANGE 1 TO 1. This condition means that if the maximum result of the query on theBboard in the range of each minute doesn't equal 1, you will receive an alert.
For more information about conditions, see the Grafana Developer Guide. - Specify the previously created notification channel in the
Send totab and add the Message you want to send to the
notification channel. In the example, the message isThe number of running jobs reached 0.
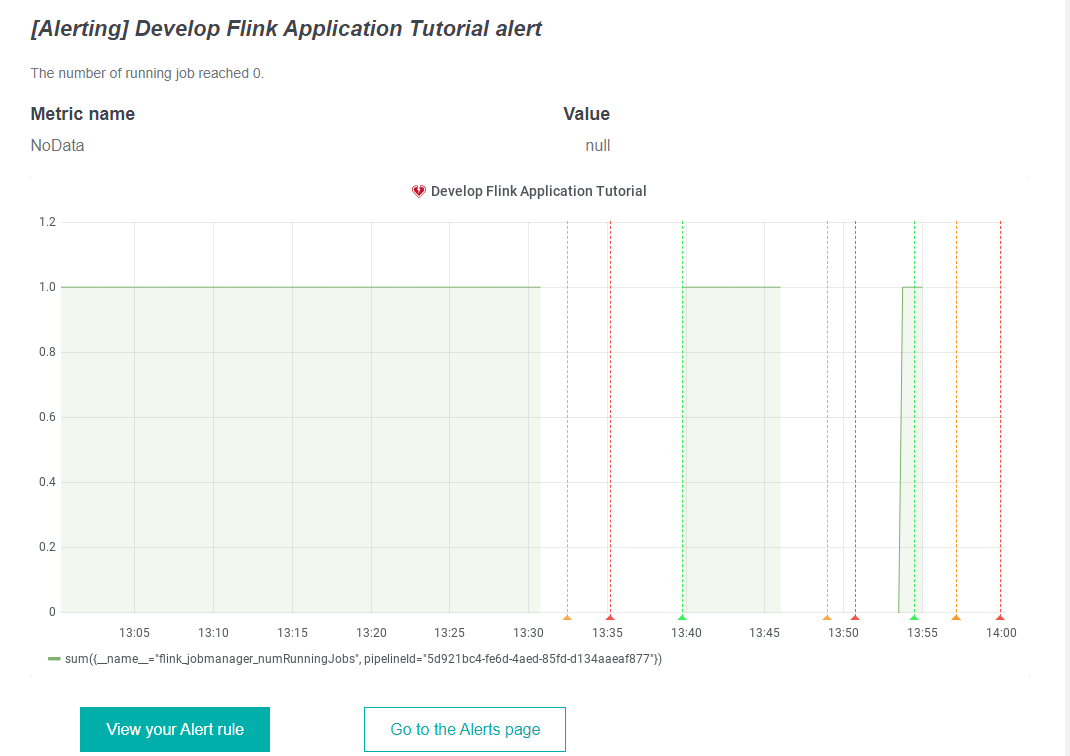
Once the Grafana Dashboard and Alerts are configured, cancel the pipeline version to check that Grafana alerts work and
that you received an alert in the email.
To cancel the pipeline version, use the following OLP CLI command:
olp pipeline version cancel $YOUR_PIPELINE_ID $YOUR_PIPELINE_TEMPLATE_ID --scope $YOUR_PROJECT_HRNA few minutes after canceling the pipeline, you will receive an alert in the email with the message you specified when
setting up the Alert.
Billing and usage
Organizations can manage their platform spending by obtaining organization, project, and/or app usage, and setting the
usage limit at different dimensions. If you are building a stack of solutions on the platform, you may want to monitor
your usage for selected services to better manage your spending. The HERE platform provides a set of cost management
tools to assist with your cost management needs.
You can differentiate the costs in two ways:
- Using Project HRN, specifically, running the pipeline in the project scope as you do in this tutorial.
- Using billingTag
, you can create a string that is used to combine expenses on your invoices. For example, you can group multiple
pipelines together for a project or activity where you want to highlight those specific costs. To be able to obtain
information about usage and billing using the billing tag, you need to create a pipeline version with
the--billing-tagparameter.
To check your billing and usage, perform the following steps:
- Open the Billing & usage tab in the platform.
- Select the time range and click Download .csv.
- Find your billing and usage by the project HRN or billing tag if you specified it when creating the pipeline version.
NoteBilling and usage data appear after 48 hours of running your application in the pipeline.
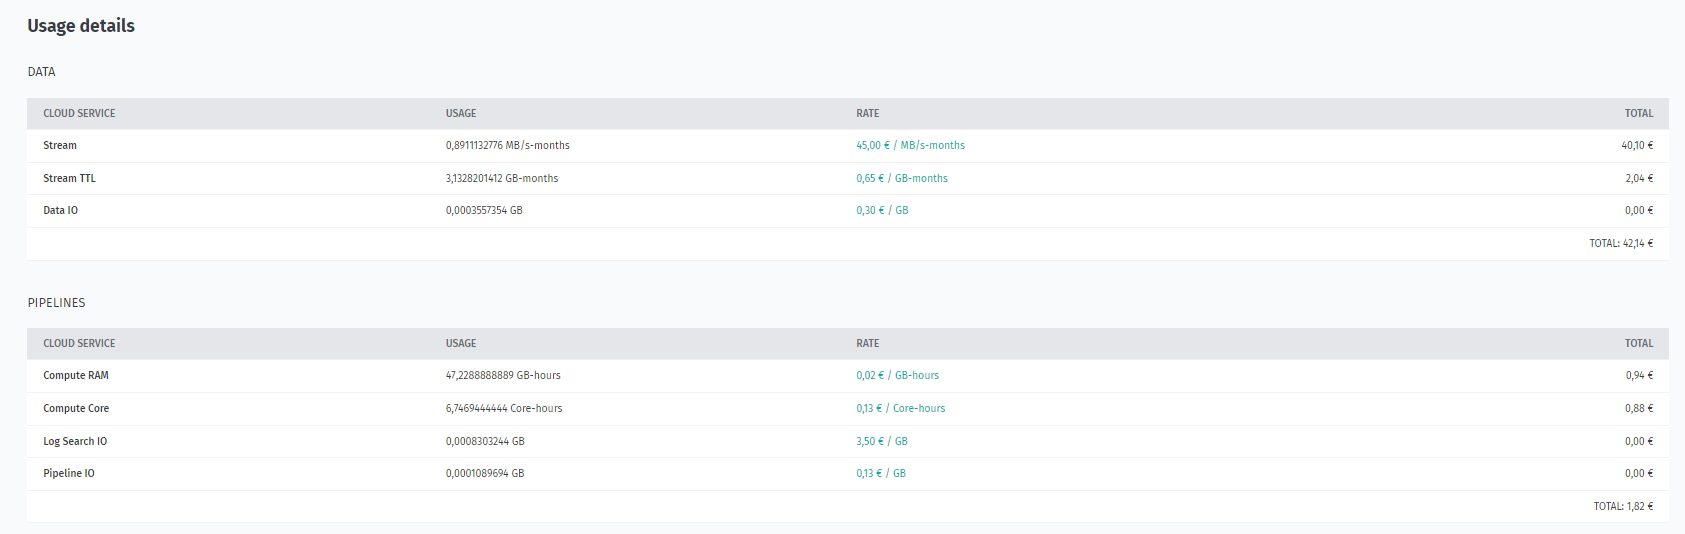
Information on which services were used during the program, how much data was used, and which items are billed is extracted
from the CSV file to the table:
| Category | Service or Resource Name | Billing Tag | Project ID | Start Date | End Date | Usage Amount | Unit | Rate per Unit ($/EUR) | Total Price |
|---|---|---|---|---|---|---|---|---|---|
| Data | Stream | project_hrn | 2022-02-01 | 2022-02-28 | 0.0596788192 | MB/s-months | 45 | 2.69 | |
| Data | Stream TTL | project_hrn | 2022-02-01 | 2022-02-28 | 0.2098083504 | GB/s-months | 0.65 | 0.14 | |
| Data | Data IO | project_hrn | 2022-02-01 | 2022-02-28 | 0.0001968937 | GB | 0.3 | 0 | |
| Pipelines | Log Search IO | develop-flink | project_hrn | 2022-02-01 | 2022-02-28 | 0.0016429862 | GB | 3.5 | 0.01 |
| Pipelines | Pipeline IO | develop-flink | project_hrn | 2022-02-01 | 2022-02-28 | 0.0004324801 | GB | 0.13 | 0 |
| Pipelines | Compute Core | develop-flink | project_hrn | 2022-02-01 | 2022-02-28 | 0.9063888889 | Core-hours | 0.13 | 0.12 |
| Pipelines | Compute RAM | develop-flink | project_hrn | 2022-02-01 | 2022-02-28 | 6.3466666667 | GB-hours | 0.02 | 0.13 |
The table shows the billing metrics for the project we have created. You can also see that the billing tag is associated only
with the pipeline metrics as it has been set only for the pipeline version and not for the stream layer.
The Data category billing metrics are connected to the usage of the stream catalog on the platform and the following
services and resources used during the application execution:
Stream- for the allocated storage queue capacity for streaming dataStream TTL- for the allocated disk storage calculated by the combination of the TTL data retention
configuration (10 minutes up to 3 days) and the “MB/s In” throughput (volume) configuration set when creating a Stream
Layer. Storage cost can be controlled by manipulating either of these values up or down.Data IO- for transfer incurred when storing and accessing data in the HERE platform, both from within
and from outside. Data IO is also incurred when ingesting data, publishing data and transferring data between
the HERE platform components. An exception exists when data is written to or read from a Stream Layer using the direct connect
protocol via the Data Client Library. In this specific case, no Data IO is incurred.
The Pipelines category billing metrics are connected to the running pipelines and the following services and resources
were used during the application execution:
Log Search IO- for the data transfer incurred when pipeline generated log information is written and
indexed for debugging purposes.Pipeline IO- for data transfer incurred when a Pipeline reads or writes data to or from the public
Internet.Compute Core- for CPU Core Hours used by Pipelines and Notebooks when processing data in the HERE platform.Compute RAM- for RAM Hours used by Pipelines and Notebooks when processing data in the HERE platform.
Another way to get a report on usage details is to indicate the project ID in the View dropdown on the Billing & usage page.
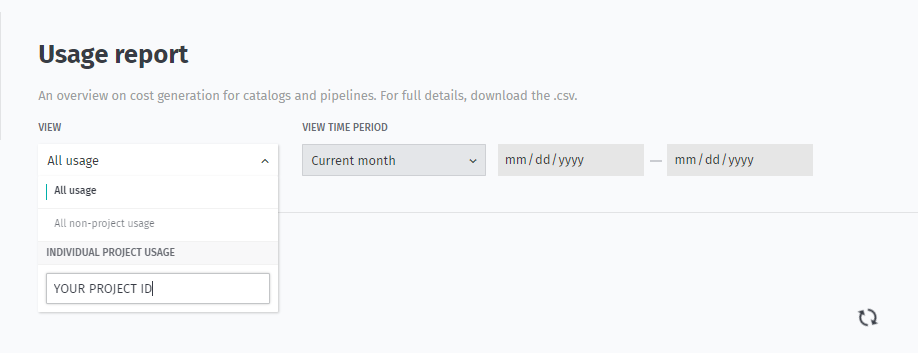
As a result, you will get aggregated usage details for your project in tabular form.
For the overview of cost concepts in the HERE platform, see the Billable services.
Conclusion
In this tutorial you have learned about the stages of development of the Flink program, learned to debug Flink
applications, got acquainted with such monitoring tools as Splunk, Grafana and Flink UI, and learned how to get Billing
information on the platform.
Further information
For more details on the topics covered in this tutorial, see the following sources:
- For more information on how to develop Flink applications, see the
Apache Flink Documentation. - For more information on how to run an application on the pipeline, see the
Pipelines Developer's Guide. - For more information on how to run an application on the pipeline using the OLP CLI, see the
OLP CLI Guide. - For information on how to use Splunk, see the
Splunk Enterprise User Documentation. - For information on how to use Grafana, see the
Introduction to Grafana. - For information about cost concepts, see the
Billable services.