視覚化のためのクラスターデータ
マップ上に数千ものポイントを持つ大規模なデータセットを表示する場合、潜在的な問題が発生することがあります。たとえば、低いズームレベルですべてのマーカーが表示されると、パフォーマンスが低下し、レンダリング時間が遅くなる可能性があります。また、地理的に近接しているマーカーが低いズームレベルで重なり合い、お互いを隠してしまうことで、マップの読みやすさが低下する場合もあります。
これらの課題に対処するには、クラスタリングの使用を検討します。クラスタリングは、画面上で近接している2つ以上のポイントを単一のクラスターポイントにまとめることで、視覚的な乱雑さを軽減し、マップ上のノイズポイント (どのクラスターにも属さない個々のデータポイント) の可視性を維持します。
このチュートリアルの例では、英国ロンドンにある空港を表すサンプルデータポイントを使用し、クラスターデータセットを作成してマップ上に表示するまでのプロセスを順を追って説明します。
注
次のセクションでは、「HERE Maps API for Javascriptの使用を開始する」で説明したベースマップを基盤として、コードを追加する方法を説明します。
クラスタリングを有効にする
必要なライブラリをインポートし、マップをクラスターの場所の中心に配置します。次の例に示すように、HTMLファイルの<head>要素にクラスタリングモジュールmapsjs-clustering.jsが含まれていることを確認します。
<!DOCTYPE html>
<html>
  <head>
    <script type="text/javascript"
        src="https://js.api.here.com/v3/3.2/mapsjs-core.js"></script>
    <script type="text/javascript"
        src="https://js.api.here.com/v3/3.2/mapsjs-service.js"></script>
    <script type="text/javascript"
        src="https://js.api.here.com/v3/3.2/mapsjs-mapevents.js"></script>
    <script type="text/javascript" charset="utf-8"
        src="https://js.api.here.com/v3/3.2/mapsjs-clustering.js"></script>
    <script type="text/javascript" charset="utf-8"
        src="https://js.api.here.com/v3/3.2/mapsjs-ui.js" ></script>
  </head>
<!-- Other HTML elements omitted for brevity -->
</html>
クラスタリングデータセットを作成する
JavaScriptスニペット内で、次の例に示すように、マップにクラスターとして表示するデータポイントを格納する変数を作成します。
const data = [
  new H.clustering.DataPoint(51.4748, -0.368),  // City Airport (LCY)
  new H.clustering.DataPoint(51.8897, 0.2629),  // Biggin Hill Airport (BQH)
  new H.clustering.DataPoint(51.4508, -0.1546), // Heathrow Airport (LHR)
  new H.clustering.DataPoint(51.3483, -0.5037), // Gatwick Airport (LGW)
  new H.clustering.DataPoint(51.1537, -0.1821), // Luton Airport (LTN)
  new H.clustering.DataPoint(51.7588, -0.262),  // Stansted Airport (STN)
];この例では、データ配列がH.clustering.DataPointのインスタンスで初期化されています。それぞれが英国ロンドンにある空港の場所を表しています。各DataPointオブジェクトには、場所の地理座標を表す緯度と経度の値が含まれています。
注
データセットを変更するには、データポイントを追加、削除、置換します。これらのメソッドを呼び出すと、再クラスタリングがトリガーされます。
クラスターデータをマップに表示する
HERE Mapsクラスタリングデータプロバイダーとレイヤーを初期化します。次に、次の例に示すように、データポイントをクラスターレイヤーとしてマップに追加します。
const clusteredDataProvider = new H.clustering.Provider(data);

// Create a layer that includes the data provider and its data points:
const layer = new H.map.layer.ObjectLayer(clusteredDataProvider);

// Add the layer to the map:
map.addLayer(layer);

// Calculate the bounding box of the data points
const bounds = new H.geo.MultiPoint(data).getBoundingBox();
// Automatically center and zoom the map to fit all data points
map.getViewModel().setLookAtData({
    bounds
});このコードは、クラスタリングアルゴリズムを実行し、画面密度に応じてデータポイントをグループ化するH.clustering.Providerオブジェクトを作成します。H.map.layer.ObjectLayerオブジェクトは、クラスター化されたデータポイントをマップに追加します。
マップを最初に読み込んだときにすべてのデータポイントが完全に表示されるようにするには、次の例に示すようにマップにパディングを追加することを検討してください。
const map = new H.Map(
  document.getElementById("mapContainer"),
  defaultLayers.vector.normal.map, {
      zoom: 10,
      // padding set to 25 pixels
      padding: {
          top: 50,
          left: 50,
          bottom: 50,
          right: 50
      },
      center: {
          lat: 52.5,
          lng: 13.4
      }
  });
次の図は、HEREクラスタリングアルゴリズムがマップ上の空港データセットを、ズームレベルに応じてクラスターまたは個別のデータポイントとしてレンダリングする方法を示しています。
クラスター作成の条件をカスタマイズする
ユースケースに合わせてクラスタリングアルゴリズムをカスタマイズするには、H.clustering.Providerクラスのパラメーターを調整します。
このクラスには、クラスターとノイズ ポイントを視覚的に表現する方法、クラスターの一部とみなされるデータ ポイントの最大半径、クラスターの形成に必要な最小重みを決定するプロパティが含まれます。
必要に応じてクラスタリング動作を調整するには、カスタマイズを使用して H.clustering.Provider インスタンスを作成します。例:
const clusteredDataProvider = new H.clustering.Provider(dataPoints, {
  min: 4,
  max: 10,
  clusteringOptions: {
    eps: 32,
    minWeight: 3
  }
});
説明
minプロパティとmaxプロパティは、H.clustering.Providerクラスの構成可能なオプションの一部ではありません。これらのオプションは、クラスタリングが発生するズーム レベルの範囲を定義します。epsプロパティは、データ ポイントがクラスターの一部と見なされる最大半径を決定します。
たとえば、コード例では、eps 値が 32 に設定されています。つまり、2 つのデータ ポイントがマップで互いに 32 ピクセル以内にある場合、クラスタリング アルゴリズムはそれらを同じクラスターの一部と見なすことを意味します。
minWeightプロパティは、クラスターを形成するために必要な最小の重みを決定します。
この例では、minWeight プロパティは 3 に設定されています。これは、クラスターを形成するには、結合された重みが少なくとも 3 である 3 つのデータ ポイントが必要であることを意味します。たとえば、それぞれの重みが 1 のデータ ポイントが 3 つある場合、または重みが 2 のデータ ポイントが 2 つと重みが 1 のデータ ポイントが 1 つある場合、それらは一緒にクラスター化されます。ただし、重みがそれぞれ1のデータポイントが2つしかない場合、それらは一緒にクラスター化されません。
次の例に示すように、対応する
DataPointを作成するときに、ポイントにカスタムの重みを割り当てることができます。new H.clustering.DataPoint(lat, lng, weight)
クラスターの表示とスタイルをカスタマイズする
マップでは、クラスターとノイズポイントはマーカーを使用して描画されます。デフォルトでは、クラスタリングプロバイダーは標準のビットマップマーカーテーマを使用します。このテーマには、マップにクラスターとノイズポイントを表示するための重み情報が組み込まれています。特定のユースケースに合わせてマーカーの外観をカスタマイズするには、カスタムテーマを作成し、プロバイダーを呼び出すときに、それをテーマプロパティの値として設定します。
次の手順では、マーカー用にカスタマイズされたサンプルテーマを示します。
-
ノイズアイコンに使用するSVGテンプレートを定義します。次のテンプレートは、内側に緑色の円が付いた SVG 要素で構成されています。
// SVG template to use for noise icons const noiseSvg = '<svg xmlns="http://www.w3.org/2000/svg" height="20px" width="20px"><circle cx="5px" cy="5px" r="5px" fill="green" /></svg>'; -
noiseSvgテンプレートを使用してH.map.Iconオブジェクトを作成します。アイコンのサイズとアンカーをピクセル単位で指定します。// Create an icon to represent the noise points // Note that same icon will be used for all noise points const noiseIcon = new H.map.Icon(noiseSvg, { size: { w: 20, h: 20 }, anchor: { x: 10, y: 10 }, }); -
クラスター アイコンに使用する SVG テンプレートを定義します。次のテンプレートは、内部に赤い円が付いた SVG 要素で構成され、円のサイズと位置は変数を使用して指定されます。
// SVG template to use for cluster icons const clusterSvgTemplate = '<svg xmlns="http://www.w3.org/2000/svg" height="{diameter}" width="{diameter}">' + '<circle cx="{radius}px" cy="{radius}px" r="{radius}px" fill="red" />' + "</svg>"; -
H.clustering.Providerオブジェクトを変更して、dataPointsの配列とtheme実装をパラメーターとして受け取ります。const clusteredDataProvider = new H.clustering.Provider(data, { theme: { getClusterPresentation: function(cluster) { const weight = cluster.getWeight(); const radius = weight * 5; const diameter = radius * 2; const svgString = clusterSvgTemplate .replace(/\{radius\}/g, radius) .replace(/\{diameter\}/g, diameter); const clusterIcon = new H.map.Icon(svgString, { size: { w: diameter, h: diameter }, anchor: { x: radius, y: radius } }); const clusterMarker = new H.map.Marker(cluster.getPosition(), { icon: clusterIcon, min: cluster.getMinZoom(), max: cluster.getMaxZoom() }); clusterMarker.setData(cluster); return clusterMarker; }, getNoisePresentation: function(noisePoint) { const noiseMarker = new H.map.Marker(noisePoint.getPosition(), { icon: noiseIcon, min: noisePoint.getMinZoom() }); noiseMarker.setData(noisePoint); return noiseMarker; } } });themeの実装では、クラスターとノイズ ポイントがマップにどのように表示されるかを指定します。その時、-
getClusterPresentation()関数は、クラスターの重みと前に定義した SVG テンプレートを使用して、クラスター アイコンのサイズと位置を計算します。次に関数は、アイコン、最小および最大ズーム レベル、マーカーのデータを使用して、クラスターのH.map.Markerオブジェクトを作成します。 -
getNoisePresentation()関数は、前に定義したのと同じSVGテンプレートを使用して各ノイズポイントのH.map.Markerオブジェクトを作成し、マーカーのアイコンと最小ズームレベルを設定します。
次の図は、データポイントをクラスタリングするためにカスタムテーマを使用した結果を示しています。この図では、クラスター マーカーは赤い円で表示され、ノイズ ポイントは緑の円で表示されています。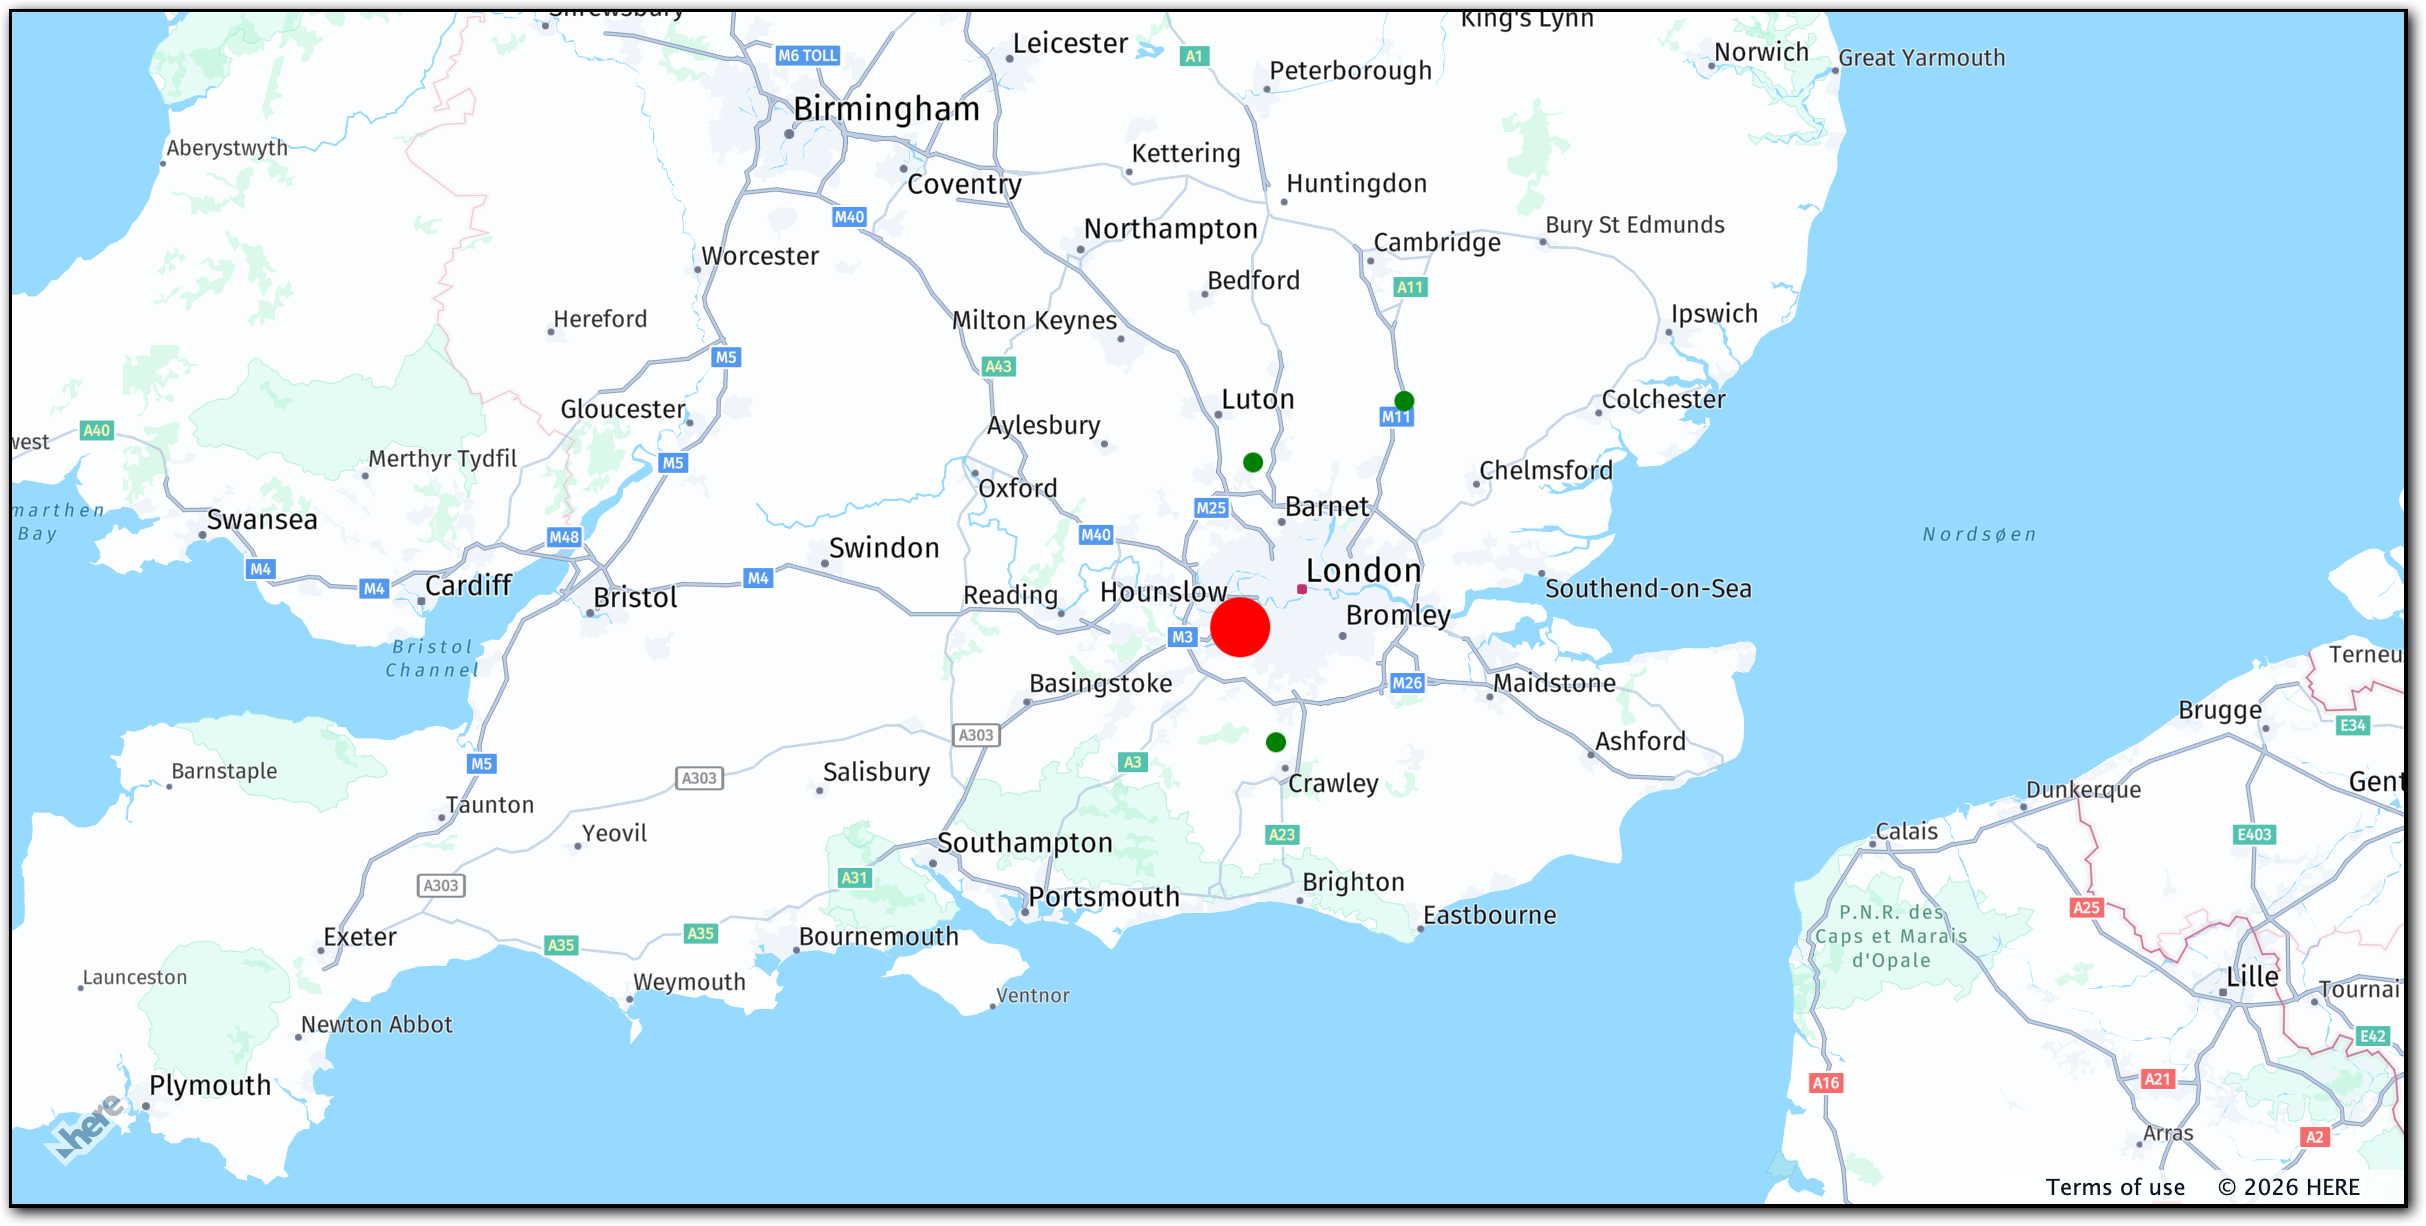
-
クラスターマーカーとノイズポイントマーカーを操作する
マップイベントを使用することで、クラスターやノイズポイントを表すマーカーを操作し、必要に応じてクラスターH.clustering.IClusterまたはノイズポイントH.clustering.INoisePointのデータにアクセスできます。
詳細については、「H.clustering」を参照してください。
クラスタリングプロバイダーで特定のイベントタイプを処理するには、そのタイプのイベントリスナーを追加します。
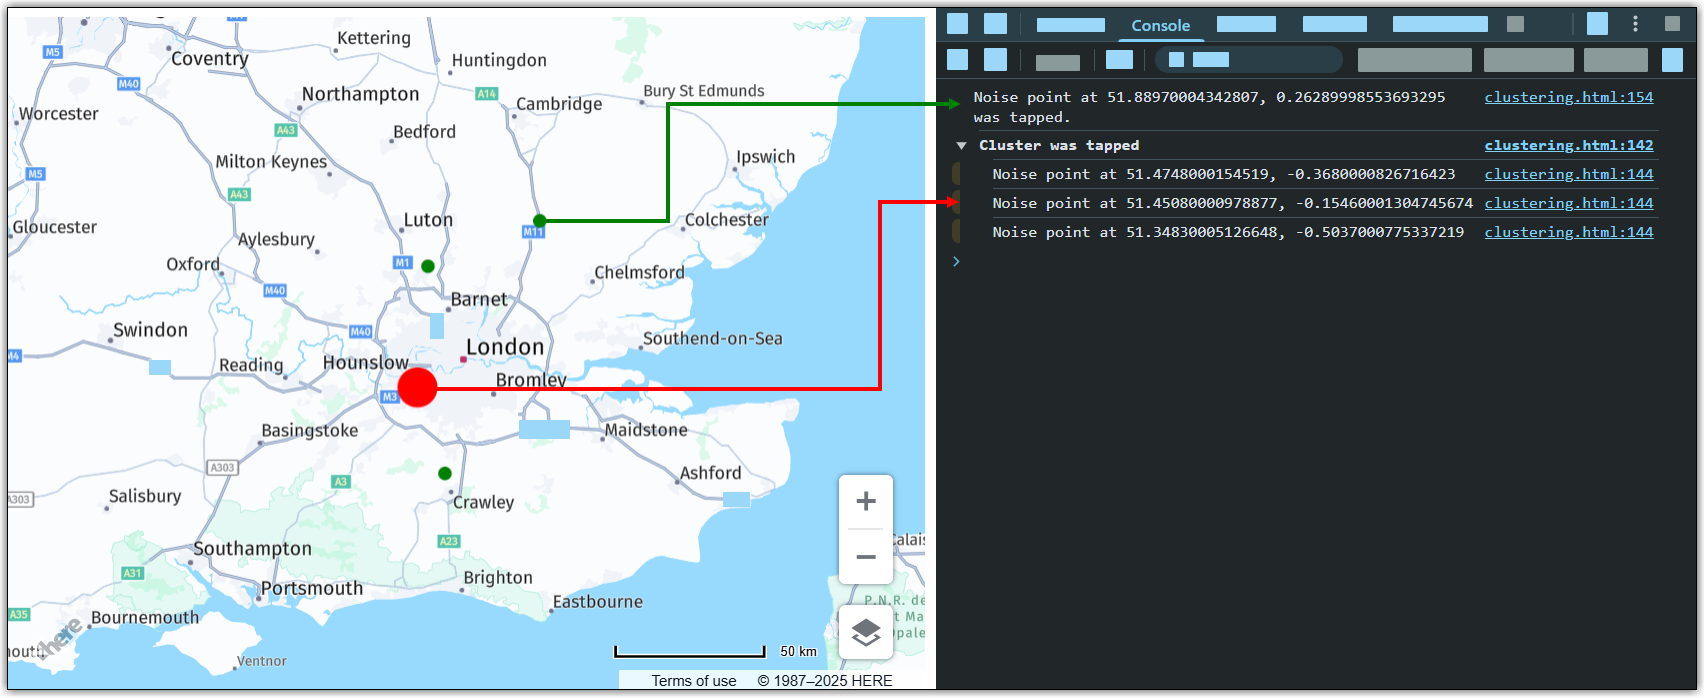
次の例では、マーカーがタップされたことを検出するために、イベントリスナーをクラスターデータプロバイダーに追加します。マーカーをタップすると、マーカーの種類に応じて、マーカーの緯度と経度がコンソールに記録されます。
// Add tap event listener to handle cluster and noise point interactions:
clusteredDataProvider.addEventListener("tap", function (event) {
const marker = event.target;
const point = marker.getData();
if (point.isCluster()) {
console.group("Cluster was tapped");
point.forEachDataPoint((dataPoint) => {
console.log(
"Noise point at " +
dataPoint.getPosition().lat +
", " +
dataPoint.getPosition().lng
);
});
console.groupEnd();
} else {
console.log(
"Noise point at " +
point.getPosition().lat +
", " +
point.getPosition().lng +
" was tapped."
);
}
}, false);次の図は、開発者コンソールウィンドウの出力を示しています。
完全なソースコード
このセクションでは、このチュートリアルで使用したJavaScriptコード全体について説明します。このコードでは、マップを設定し、マップに複数のマーカーを追加します。これらのマーカーは、近接度に基づいてクラスター化されます。また、このコードは、クリックされたときのマーカーの外観と動作を定義し、クリックされたすべてのマーカーの緯度と経度を記録するイベント リスナーを追加します。最後に、このコードはマップでデフォルトのパンとズームの相互作用を有効にします。
// Initiate and authenticate your connection to the HERE platform:
const platform = new H.service.Platform({
apikey: 'apikey'
});
// Obtain the default map types from the platform object:
const defaultLayers = platform.createDefaultLayers();
// Instantiate (and display) a map:
const map = new H.Map(
document.getElementById("mapContainer"),
defaultLayers.vector.normal.map, {
zoom: 10,
padding: {
top: 50,
left: 50,
bottom: 50,
right: 50
},
center: {
lat: 52.5,
lng: 13.4
}
}
);
// Define noise data points (e.g., airport locations):
const data = [
new H.clustering.DataPoint(51.4748, -0.368), // City Airport (LCY)
new H.clustering.DataPoint(51.8897, 0.2629), // Biggin Hill Airport (BQH)
new H.clustering.DataPoint(51.4508, -0.1546), // Heathrow Airport (LHR)
new H.clustering.DataPoint(51.3483, -0.5037), // Gatwick Airport (LGW)
new H.clustering.DataPoint(51.1537, -0.1821), // Luton Airport (LTN)
new H.clustering.DataPoint(51.7588, -0.262), // Stansted Airport (STN)
];
// SVG template for noise icons:
const noiseSvg =
'<svg xmlns="http://www.w3.org/2000/svg" height="20px" width="20px">' +
'<circle cx="10" cy="10" r="5" fill="green" />' +
'</svg>';
// Create a reusable icon for noise points:
const noiseIcon = new H.map.Icon(noiseSvg, {
size: {
w: 20,
h: 20
},
anchor: {
x: 10,
y: 10
}
});
// SVG template for cluster icons:
const clusterSvgTemplate =
'<svg xmlns="http://www.w3.org/2000/svg" height="{diameter}" width="{diameter}">' +
'<circle cx="{radius}" cy="{radius}" r="{radius}" fill="red" />' +
'</svg>';
// Create a clustered data provider with custom presentation logic:
const clusteredDataProvider = new H.clustering.Provider(data, {
  theme: {
    getClusterPresentation: function(cluster) {
      const weight = cluster.getWeight();
      const radius = weight * 5;
      const diameter = radius * 2;

      const svgString = clusterSvgTemplate
      .replace(/\{radius\}/g, radius)
      .replace(/\{diameter\}/g, diameter);

      const clusterIcon = new H.map.Icon(svgString, {
        size: {
          w: diameter,
          h: diameter
        },
        anchor: {
          x: radius,
          y: radius
        }
      });

      const clusterMarker = new H.map.Marker(cluster.getPosition(), {
        icon: clusterIcon,
        min: cluster.getMinZoom(),
        max: cluster.getMaxZoom()
      });

      clusterMarker.setData(cluster);
      return clusterMarker;
    },

    getNoisePresentation: function(noisePoint) {
      const noiseMarker = new H.map.Marker(noisePoint.getPosition(), {
        icon: noiseIcon,
        min: noisePoint.getMinZoom()
      });

      noiseMarker.setData(noisePoint);
      return noiseMarker;
    }
  }
});
// Add tap event listener to handle cluster and noise point interactions:
clusteredDataProvider.addEventListener("tap", function(event) {
const marker = event.target;
const point = marker.getData();
if (point.isCluster()) {
console.group("Cluster was tapped");
point.forEachDataPoint((dataPoint) => {
console.log(
"Noise point at " +
dataPoint.getPosition().lat +
", " +
dataPoint.getPosition().lng
);
});
console.groupEnd();
} else {
console.log(
"Noise point at " +
point.getPosition().lat +
", " +
point.getPosition().lng +
" was tapped."
);
}
}, false);
// Create and add the clustered layer to the map:
const layer = new H.map.layer.ObjectLayer(clusteredDataProvider);
map.addLayer(layer);
// Automatically center and zoom the map to fit all data points:
const bounds = new H.geo.MultiPoint(data).getBoundingBox();
map.getViewModel().setLookAtData({
bounds
});
// Enable default map interactions (pan/zoom):
const behavior = new H.mapevents.Behavior(new H.mapevents.MapEvents(map));
// Handle dynamic resizing of the map container:
window.addEventListener('resize', () => map.getViewPort().resize());
// Create default UI controls:
const ui = H.ui.UI.createDefault(map, defaultLayers);次のステップ
HERE Maps API for JavaScriptの設計と機能の詳細については、「APIリファレンス」を参照してください。
2 か月前の更新