Add custom layers
The HERE SDK provides extensive options for customizing your map with the HERE Style Editor and the Style class. More options are described below.
- Custom raster layers: Overlay tiled images on top of your map schemes with raster data sources.
- Point, tile, and polygon custom layers: Use point, tile and polygon layers to add customizable content to the map.
- Tile data sources for point, tile, and polygon custom layers: Efficiently manage and display large datasets by supplying point, tile, or polygon sources.
Add custom raster layers
With custom raster layers you can add your own raster tile service on top of the HERE MapScheme styles. This can be your own server where you host tiles that you want to show as an overlay on top of selected areas of the world - or a public tile server such as OpenStreetMap. Fully opaque and transparent map tile overlays are supported. It is also possible to add more than one raster layer to the map at the same time.
NoteNote that this is a beta release of this feature, so there could be a few bugs and unexpected behaviors. Related APIs may change for new releases without a deprecation process.
To add custom raster layers, you need to create a RasterDataSource. A RasterDataSource represents the source of raster tile data to display. It also allows changing its configuration. With a RasterDataSourceConfiguration you can specify a configuration for the data source, including URL, tiling scheme, storage levels and caching parameters.
Finally, with the MapLayerBuilder you can create a MapLayer to add a renderable map overlay to the map.
- Use
MapLayerVisibilityRangeto specify at which zoom levels the map layer should become visible. - Use the
MapLayerPriorityto specify the draw order of theMapLayer. - Use the
MapContentTypeto specify the type of data to be shown by theMapLayer. - Optionally, use the
StyleAPI to adjust properties such as opacity or brightness at runtime. More about this can be found in the style guide for custom layers.
In case of raster tile images, use MapContentType.rasterImage.
Default map gesture actions such as pinch, rotate and zoom behave in the same way for raster tiles as for HERE vector maps - except for a few differences: for example, raster tiles are loaded as bitmaps and therefore a rotated raster map tile rotates all labels and street names contained together with the tile.
NoteWhen loading a map scene with a custom map style or the default map style, the map will be rendered using vector tiles where the map information is represented as vector data consisting of vertices and paths for better scalability and performance. By contrast, raster tiles are regularly spaced and square, and consist of bitmap images that represent only pixel information. Note that the satellite map style is also raster based.
Create a RasterDataSource as follows:
// Hold references to the data sources and layers.
RasterDataSource? _outdoorDataSource;
RasterDataSource? _transportDataSource;
MapLayer? _outdoorLayer;
MapLayer? _transportLayer;

RasterDataSource _createRasterDataSourceWithTemplate(String dataSourceName, String templateUrl) {
  // The storage levels available for this data source. Supported range [0, 31].
  List<int> storageLevels = [2, 3, 4, 5, 6, 7, 8, 9, 10, 11, 12, 13, 14, 15, 16];
  RasterDataSourceProviderConfiguration rasterProviderConfig = RasterDataSourceProviderConfiguration.withDefaults(
    TileUrlProviderFactory.fromXyzUrlTemplate(templateUrl)!,
    TilingScheme.quadTreeMercator,
    storageLevels,
  );

  // If you want to add transparent layers then set this to true.
  rasterProviderConfig.hasAlphaChannel = false;

  // Use a dedicated cache path per data source to keep layers separated on disk.
  // Raster tiles are stored in a separate cache, independent from the map cache used for vector data.
  String path = 'cache/raster/' + dataSourceName;
  int maxDiskSizeInBytes = 1024 * 1024 * 128; // 128 MB
  RasterDataSourceCacheConfiguration cacheConfig = RasterDataSourceCacheConfiguration(path, maxDiskSizeInBytes);

  // Note that this will make the raster source already known to the passed map view.
  return RasterDataSource(
    _hereMapController.mapContext,
    RasterDataSourceConfiguration.withDefaults(dataSourceName, rasterProviderConfig, cacheConfig),
  );
}
Note that - if desired - you can also hook into the calls of the templateUrl like so:
final providerConfig = RasterDataSourceProviderConfiguration.withUrlProviderAndDefaults(
  TilingScheme.quadTreeMercator,
  storageLevels,
  (int x, int y, int level) {
    return "https://tile.thunderforest.com/outdoors/$level/$x/$y.png";
  },
);
The latter gives you an option to listen to each tile request and, for example, allows for finer control on the requested tiles, if needed.
Note that custom raster layers use their own cache directory, which can be independent of the map cache that is used for vector-based map data. Find more details in the API Reference for the RasterDataSourceConfiguration.
This code uses a tile source from Thunderforest. More details on the terms of usage can be found on https://www.thunderforest.com/terms/ and on https://www.osm.org/copyright.
Note that you can also use other tile sources that follow the OSM standard style format /zoom/x/y.png. The templateURL should look like this:
https://YourRasterTileService.com/{zoom}/{xTile}/{yTile}.png
Here, the zoom value represents the map's current zoom level, and xTile and yTile defines the horizontal and vertical tile numbers. For example, to show the standard OSM map, use the following template URL:
let templateUrl = "https://a.tile.openstreetmap.org/{z}/{x}/{y}.png"
More tile servers following the OSM format are listed here. Note that the HERE SDK supports only tile servers. Servers that provide vector data are not supported. Vector based tiles can only be used with the HERE Style Editor and the embedded map styles (see above).
Once a tile source is created, a MapLayer can be built:
MapLayer _createMapLayer(String dataSourceName) {
  // The layer should be rendered on top of other layers including the "labels" layer
  // so that we don't overlap the raster layer over POI markers.
  MapLayerPriority priority = MapLayerPriorityBuilder().renderedAfterLayer("labels").build();

  // And it should be visible for all zoom levels. The minimum tilt level is 0 and maximum zoom level is 23.
  MapLayerVisibilityRange range = MapLayerVisibilityRange(MapCameraLimits.minTilt, MapCameraLimits.maxZoomLevel);

  try {
    // Build and add the layer to the map.
    MapLayer mapLayer = MapLayerBuilder()
        .forMap(_hereMapController.hereMapControllerCore) // mandatory parameter
        .withName(dataSourceName + "Layer") // mandatory parameter
        .withDataSource(dataSourceName, MapContentType.rasterImage)
        .withPriority(priority)
        .withVisibilityRange(range)
        .build();
    return mapLayer;
  } on MapLayerBuilderInstantiationException {
    throw Exception("MapLayer creation failed.");
  }
}
Above we reference the "labels" layer. More information on existing layers and their names can be found in the API Reference for the MapLayerPriorityBuilder.
To create the layers in your class, initialize both data sources and layers before setting visibility:
void _initializeRasterLayers() {
  // Note: As an example, below are URL templates of an outdoor and a transport layer from thunderforest.com.
  // On their web page you can register a key. Without setting a valid API key, the tiles will
  // show a watermark.
  // More details on the terms of usage can be found here: https://www.thunderforest.com/terms/
  // For example, your application must have working links to https://www.thunderforest.com
  // and https://www.osm.org/copyright.
  // For the below URL templates, please pay attention to the following attribution:
  // Maps © www.thunderforest.com, Data © www.osm.org/copyright.
  // Alternatively, choose another tile provider or use the (customizable) map styles provided by HERE.
  const String templateUrlOutdoors = 'https://tile.thunderforest.com/outdoors/{z}/{x}/{y}.png';
  const String templateUrlTransport = 'https://tile.thunderforest.com/transport/{z}/{x}/{y}.png';

  const String outdoorDataSourceName = 'myRasterDataSourceOutdoors';
  _outdoorDataSource = _createRasterDataSourceWithTemplate(
    outdoorDataSourceName,
    templateUrlOutdoors,
  );
  _outdoorLayer = _createMapLayer(outdoorDataSourceName);
  _outdoorLayer?.setEnabled(false);

  const String transportDataSourceName = 'myRasterDataSourceTransport';
  _transportDataSource = _createRasterDataSourceWithTemplate(
    transportDataSourceName,
    templateUrlTransport,
  );
  _transportLayer = _createMapLayer(transportDataSourceName);
  _transportLayer?.setEnabled(false);
}
Finally, the visibility can be controlled by enabling or disabling the layer as shown below. Note that you also need to provide a unique name. Each RasterDataSource can be created only once:
// Enable only one layer at a time (toggle).
_transportLayer?.setEnabled(false);
_outdoorLayer?.setEnabled(true);

// To switch to Transport layer:
// _outdoorLayer?.setEnabled(false);
// _transportLayer?.setEnabled(true);
The resulting layer looks like this:
The above screenshot shows that you can easily combine custom raster tiles with other HERE SDK features. For example, you can render several MapMarker instances on top of the tile data from a tile server.
NoteOne of the main advantages of custom raster layers is that you can easily enhance the HERE map styles with a transparent custom tile source on top, for example, to show weather data or any other data you want to see on top of the map. When using an opaque raster tile source, it is recommended to combine this with an empty base map style.
If you do not use an empty base map style, then the underlying map scheme will "shine" through until the raster layer tiles are loaded. The accompanying example app shows how this looks like.
There are certain other parameters that you can adjust:
- If your app uses multiple raster layers, you can define a load priority when building a layer with the
MapLayerBuilder. This allows to specify an integer value: Higher values will lead to load the layer before layers with lower values. Note that this controls just the time when the layer is loaded. - The
MapLayerPrioritycontrols how the layer is rendered: For example, optionally, you can appendrenderedLast()which means that the layer will be rendered on top of all other layers. - For showing transparent map styles, set
rasterProviderConfig.hasAlphaChannelto true. - For more parameters, please consult the API Reference.
Another option (only available for Navigate) to reduce the loading time while panning the map can be to adjust the feature configuration.
Add custom layers to hold lines, polygons and points
Another alternative to customize the map's appearance is by adding your own custom line, polygon and point layers with the Style class. This provides more flexibility to update the visual appearance at runtime. For most use cases, consider to use MapMarker, MapPolyline or MapPolygon instead. See the map items section. When you are working with a very large amount of custom data, consider to use line, polygon and point tile sources instead to ensure better performance and scalability.
Add custom line layers
Custom geodetic lines can be added to the map's appearance by adding your own custom data layer on top of the HERE MapScheme styles.
A geodetic line is the shortest line between any two points on the Earth's surface, with each point represented through geodetic coordinates.
NoteNote that this is a beta release of this feature, so there could be a few bugs and unexpected behaviors. Related APIs may change for new releases without a deprecation process.
To add custom line layers, you need to create a LineDataSource. A LineDataSource represents the source of geodetic lines data to display.
Each geodetic line can be coupled with a set of custom data attributes that can be used to customize the look of each line when displayed on top of the map.
On top of a LineDataSource, with MapLayerBuilder you can create a MapLayer to add a renderable map overlay to the map.
- Use
MapLayerVisibilityRangeto specify at which zoom levels the map layer should become visible. - Use the
MapLayerPriorityto specify the draw order of theMapLayer. - Use the
MapContentTypeto specify the type of data to be shown by theMapLayer. In case of geodetic lines, useMapContentType.LINE. - Use the
StyleAPI to adjust properties such as width or color at runtime. More about this can be found in the style guide for custom layers.
Create a LineDataSource as follows:
String myCustomLinesDataSourceName = "MyCustomLines";

LineDataSource createLineDataSource(String dataSourceName) {
    // Creates a new LineDataSource, without custom data.
    // To also add custom lines while creating the data source, `LineDataSourceBuilder.withPolyline` API can be used.
    return LineDataSourceBuilder(_hereMapController.mapContext).withName(dataSourceName).build();
}
Once a line data source is created, custom geodetic lines can be added to it:
void addLinesToDataSource(LineDataSource linesDataSource) {
    // Prepare the geodetic list of points that make-up the line.
    List<GeoCoordinates> lineGeoPoints = [GeoCoordinates(point1GeoLatitude, point1GeoLongitude),
                                          ...
                                          GeoCoordinates(pointNGeoLatitude, pointNGeoLongitude)];

    // Optional: Prepare a list of custom attributes.
    DataAttributes lineAttributes = DataAttributesBuilder().with("id", "my first line").build();

    // Add the line to data source.
    linesDataSource.add(LineDataBuilder().withGeometry(GeoPolyline(lineGeoPoints))
                                         .withAttributes(lineAttributes)
                                         .build();

    // Repeat above steps to add more custom lines to the data source.
    // Alternatively, use `LineDataSource.addLines` to add multiple custom lines with a single call.
    ...
}
Prepare a custom style for your lines layer:
NoteThe
layervalue in the style string must match the name given to the MapLayer in the next steps. In this example, thedataSourceNameused isMyCustomLinesand the layer nameMyCustomLinesLayer.
String myCustomLayerStyle = """
{
  "styles": [
    {
        "layer": "MyCustomLinesLayer",
        "technique": "line",
        "attr": {
            "width": 5.0,
            "color": "#ff0000ff"
        }
    }
  ]
}
""";

Style _createCustomStyle() {
  try {
      return JsonStyleFactory.createFromString(myCustomLayerStyle);
  } on JsonStyleFactoryInstantiationException {
      // Custom exception handling.
      ...
  }

  return null;
}
To display a LineDataSource on top of a map, a MapLayer can be built:
MapLayer _createMapLayer(String dataSourceName, Style customStyle) {
  // Set the layer to be rendered on top of other layers.
  MapLayerPriority priority = MapLayerPriorityBuilder().renderedLast().build();
  // And make it visible for all zoom levels. The minimum tilt level is 0 and maximum zoom level is 23.
  MapLayerVisibilityRange range = MapLayerVisibilityRange(MapCameraLimits.minTilt, MapCameraLimits.maxZoomLevel);

  try {
    // Build and add the layer to the map.
    MapLayer mapLayer = MapLayerBuilder()
        .forMap(_hereMapController.hereMapControllerCore) // mandatory parameter
        .withName(dataSourceName + "Layer") // mandatory parameter
        .withDataSource(dataSourceName, MapContentType.line)
        .withPriority(priority)
        .withVisibilityRange(range)
        .withStyle(customStyle)
        .build();
    return mapLayer;
  } on MapLayerBuilderInstantiationException {
    throw Exception("MapLayer creation failed.");
  }
}
Add custom polygon layers
Custom geodetic polygons can be added to the map's appearance by adding your own custom data layer on top of the HERE MapScheme styles.
A geodetic polygon is defined by an exterior geodetic boundary, and optionally one or more interior boundaries. Each boundary is made from a closed sequence of geodetic points (the first point is the same as the last one).
NoteNote that this is a beta release of this feature, so there could be a few bugs and unexpected behaviors. Related APIs may change for new releases without a deprecation process.
To add custom polygon layers, you need to create a PolygonDataSource. A PolygonDataSource represents the source of geodetic polygon data to display.
Each geodetic polygon can be coupled with a set of custom data attributes that can be used to customize the look of each polygon when displayed on top of the map.
On top of a PolygonDataSource, with MapLayerBuilder you can create a MapLayer to add a renderable map overlay to the map.
- Use
MapLayerVisibilityRangeto specify at which zoom levels the map layer should become visible. - Use the
MapLayerPriorityto specify the draw order of theMapLayer. - Use the
MapContentTypeto specify the type of data to be shown by theMapLayer. In case of geodetic polygons, useMapContentType.POLYGON. - Use the
StyleAPI to adjust properties such as color at runtime. More about this can be found in the style guide for custom layers.
Create a PolygonDataSource as follows:
String myCustomPolygonsDataSourceName = "MyCustomPolygons";

PolygonDataSource createPolygonDataSource(String dataSourceName) {
    // Creates a new PolygonDataSource, without custom data.
    // To also add custom polygons while creating the data source, `PolygonDataSourceBuilder.withPolygon` API can be used.
    return PolygonDataSourceBuilder(_hereMapController.mapContext).withName(dataSourceName).build();
}
Once a polygon data source is created, custom geodetic polygons can be added to it:
void addPolygonsToDataSource(PolygonDataSource polygonsDataSource) {
    // Prepare the geodetic list of points that make-up the polygon.
    // Note: The point list must be closed and given in clockwise order.
    List<GeoCoordinates> polygonGeoPoints = [GeoCoordinates(point1GeoLatitude, point1GeoLongitude),
                                             ...,
                                             GeoCoordinates(pointNGeoLatitude, pointNGeoLongitude),
                                             ...,
                                             GeoCoordinates(point1GeoLatitude, point1GeoLongitude)];

    // Optional: Prepare a list of custom attributes.
    DataAttributes polygonAttributes = DataAttributesBuilder().with("id", "my first polygon").build();

    // Add the polygon to data source.
    polygonsDataSource.add(PolygonDataBuilder().withGeometry(GeoPolygon(polygonGeoPoints))
                                               .withAttributes(polygonAttributes)
                                               .build();

    // Repeat above steps to add more custom polygon to the data source.
    // Alternatively, use `PolygonDataSource.addPolygons` to add multiple custom polygons with a single call.
    ...
}
Prepare a custom style for your polygons layer:
NoteThe
layervalue in the style string must match the name given to the MapLayer in the next steps. In this example, thedataSourceNameused isMyCustomPolygonsand the layer nameMyCustomPolygonsLayer.
String myCustomLayerStyle = """
{
  "styles": [
    {
        "layer": "MyCustomPolygonsLayer",
        "technique": "polygon",
        "attr": {
            "color": "#ff0000ff"
        }
    }
  ]
}
""";

Style _createCustomStyle() {
  try {
      return JsonStyleFactory.createFromString(myCustomLayerStyle);
  } on JsonStyleFactoryInstantiationException {
      // Custom exception handling.
      ...
  }

  return null;
}
To display a PolygonDataSource on top of a map, a MapLayer can be built:
MapLayer _createMapLayer(String dataSourceName, Style customStyle) {
  // Set the layer to be rendered on top of other layers.
  MapLayerPriority priority = MapLayerPriorityBuilder().renderedLast().build();
  // And make it visible for all zoom levels. The minimum tilt level is 0 and maximum zoom level is 23.
  MapLayerVisibilityRange range = MapLayerVisibilityRange(MapCameraLimits.minTilt, MapCameraLimits.maxZoomLevel);

  try {
    // Build and add the layer to the map.
    MapLayer mapLayer = MapLayerBuilder()
        .forMap(_hereMapController.hereMapControllerCore) // mandatory parameter
        .withName(dataSourceName + "Layer") // mandatory parameter
        .withDataSource(dataSourceName, MapContentType.polygon)
        .withPriority(priority)
        .withVisibilityRange(range)
        .withStyle(customStyle)
        .build();
    return mapLayer;
  } on MapLayerBuilderInstantiationException {
    throw Exception("MapLayer creation failed.");
  }
}
Add custom point layers
Custom geodetic points can be added to the map's appearance by adding your own custom data layer on top of the HERE MapScheme styles.
NoteNote that this is a beta release of this feature, so there could be a few bugs and unexpected behaviors. Related APIs may change for new releases without a deprecation process.
To add custom point layers, you need to create a PointDataSource. A PointDataSource represents the source of geodetic point data to display.
Each geodetic point can be coupled with a set of custom data attributes that can be used to customize the look of each point when displayed on top of the map.
On top of a PointDataSource, with MapLayerBuilder you can create a MapLayer to add a renderable map overlay to the map.
- Use
MapLayerVisibilityRangeto specify at which zoom levels the map layer should become visible. - Use the
MapLayerPriorityto specify the draw order of theMapLayer. - Use the
MapContentTypeto specify the type of data to be shown by theMapLayer. In case of geodetic points, useMapContentType.POINT. - Use the
StyleAPI to adjust properties such as icon at runtime. More about this can be found in the style guide for custom layers.
Create a PointDataSource as follows:
String myCustomPointsDataSourceName = "MyCustomPoints";

PointDataSource createPointDataSource(String dataSourceName) {
    // Creates a new PointDataSource, without custom data.
    // To also add custom points while creating the data source, `PointDataSourceBuilder.withPoint` API can be used.
    return PointDataSourceBuilder(_hereMapController.mapContext).withName(dataSourceName).build();
}
Once a point data source is created, custom geodetic points can be added to it:
void addPointsToDataSource(PointDataSource pointsDataSource) {
    // Prepare the geodetic point.
    // Note: The point list must be closed and given in clockwise order.
    GeoCoordinates geoPoint = GeoCoordinates(pointGeoLatitude, pointGeoLongitude);

    // Optional: Prepare a list of custom attributes.
    DataAttributes pointAttributes = DataAttributesBuilder().with("id", "my first point").build();

    // Add the point to data source.
    pointsDataSource.add(PointDataBuilder().withCoordinates(geoPoint)
                                           .withAttributes(pointAttributes)
                                           .build();

    // Repeat above steps to add more custom points to the data source.
    // Alternatively, use `PointDataSource.addPoints` to add multiple custom points with a single call.
    ...
}
Prepare a custom style for your points layer:
NoteThe
layervalue in the style string must match the name given to the MapLayer in the next steps. In this example, thedataSourceNameused isMyCustomPointsand the layer nameMyCustomPointsLayer.
String myCustomLayerStyle = """
{
  "styles": [
    {
        "layer": "MyCustomPointsLayer",
        "technique": "icon-text",
        "attr": {
            "icon-source": "my_icon.png"
        }
    }
  ]
}
""";

Style _createCustomStyle() {
  try {
      return JsonStyleFactory.createFromString(myCustomLayerStyle);
  } on JsonStyleFactoryInstantiationException {
      // Custom exception handling.
      ...
  }

  return null;
}
To display a PointDataSource on top of a map, a MapLayer can be built:
MapLayer _createMapLayer(String dataSourceName, Style customStyle) {
  // Set the layer to be rendered on top of other layers.
  MapLayerPriority priority = MapLayerPriorityBuilder().renderedLast().build();
  // And make it visible for all zoom levels. The minimum tilt level is 0 and maximum zoom level is 23.
  MapLayerVisibilityRange range = MapLayerVisibilityRange(MapCameraLimits.minTilt, MapCameraLimits.maxZoomLevel);

  try {
    // Build and add the layer to the map.
    MapLayer mapLayer = MapLayerBuilder()
        .forMap(_hereMapController.hereMapControllerCore) // mandatory parameter
        .withName(dataSourceName + "Layer") // mandatory parameter
        .withDataSource(dataSourceName, MapContentType.point)
        .withPriority(priority)
        .withVisibilityRange(range)
        .withStyle(customStyle)
        .build();
    return mapLayer;
  } on MapLayerBuilderInstantiationException {
    throw Exception("MapLayer creation failed.");
  }
}
Add custom data attributes to custom layers
Any custom object such as a geodetic line can be coupled with a set of attributes. Such attributes are generic key-value pairs and can be freely defined by the developer.
For example, such user-defined attributes can be used to tag each object with a unique identifier:
DataAttributes lineAttributes = DataAttributesBuilder().with("id", "my first line").build();Another use case is to use attributes along with style expressions to customize the look of each object when displayed on top of the map:
// Define a layer style string that would use per-line object width and color values
// that are stored inside line custom data attributes. For that purpose, the 'get' expression is used.
String myCustomLayerStyle = """
{
    "styles": [
        {
            "layer": "MyCustomLinesLayer",
            "technique": "line",
            "attr": {
                "width": ["get", "lineWidthInMeters"],
                "color": ["to-color", ["get", "lineColor"]]
            }
        }
    ]
}

// Define specific values for "lineWidth" and "lineColor" per line object.
DataAttributes lineAttributes = DataAttributesBuilder().with("lineWidthInMeters", 10.0)
                                                       .with("lineColor", "#ff0000ff").build();
...
Add custom tile sources
Tile source support for points, lines and polygons is an advanced feature designed for scenarios, where users need to integrate and visualize large volumes of custom geospatial data. For example, to visualize EV charging stations or shop locations around the globe. While APIs like MapMarker or MapPolyline are sufficient for smaller datasets, they become inefficient for large-scale use due to high memory consumption. Also, custom point, tile and polygon layers using custom data sources like PointDataSource are not suitable for large volumes of data. Instead, consider to use PointTileDataSource, LineTileDataSource or PolygonTileDataSource instead - as described in this chapter.
NoteNote that the data is loaded on a per-tile basis, ensuring that the entire dataset is not loaded globally at once.
Add custom point tile source
You can enhance the map's appearance by adding a custom point tile source, allowing additional layers of point data to be rendered on top of the default HERE MapScheme. This approach enables seamless integration of point data, even when its format is not natively supported by the HERE SDK.
A Point Tile Data Source can be used to display locations such as points of interest (POIs), real-time vehicle tracking, event markers, etc.
NoteNote that this is a beta release of this feature, so there could be a few bugs and unexpected behaviors. Related APIs may change for new releases without a deprecation process.
To add a custom point tile source, you need to create a PointTileDataSource. The PointTileDataSource facilitates the creation of point tile sources, while PointTileSource provides a mechanism to supply custom point data based on the requested TileKey. It uses JSON-based styling to control the appearance of the custom point tile source and integrates it into the map.
On top of a PointTileDataSource, with MapLayerBuilder you can create a MapLayer to add a renderable map overlay to the map.
- Use
MapLayerVisibilityRangeto specify at which zoom levels the map layer should become visible. - Use the
MapContentTypeto specify the type of data to be shown by theMapLayer. In case of geodetic points, useMapContentType.POINT. - Use the
StyleAPI to adjust properties such as icon at runtime.
Create a PointTileDataSource as follows:
HereMapController _hereMapController;
MapLayer? _pointMapLayer;
PointTileDataSource? _pointDataSource;

CustomPointTileSourceExample(this._hereMapController) {
  String dataSourceName = "MyPointDataSource";
  _pointDataSource = _createPointTileDataSource(dataSourceName);
  _pointMapLayer = _createMapLayer(dataSourceName);

  double distanceToEarthInMeters = 60 * 1000;
  MapMeasure mapMeasureZoom =
      MapMeasure(MapMeasureKind.distanceInMeters, distanceToEarthInMeters);
  _hereMapController.camera.lookAtPointWithMeasure(
      GeoCoordinates(52.530932, 13.384915), mapMeasureZoom);
}
Create a custom point data source and load the tile:
PointTileDataSource _createPointTileDataSource(String dataSourceName) {
var localPointTileSource = LocalPointTileSource();
// Create a PointTileDataSource using a local point tile source.
// Note that this will make the point source already known to the passed map view.
return PointTileDataSource.create(
_hereMapController.mapContext, dataSourceName, localPointTileSource);
}
@override
TileSourceLoadTileRequestHandle? loadTile(
TileKey tileKey, PointTileSourceLoadResultHandler completionHandler) {
// For each tile, provide the tile geodetic center as a custom point, with a single
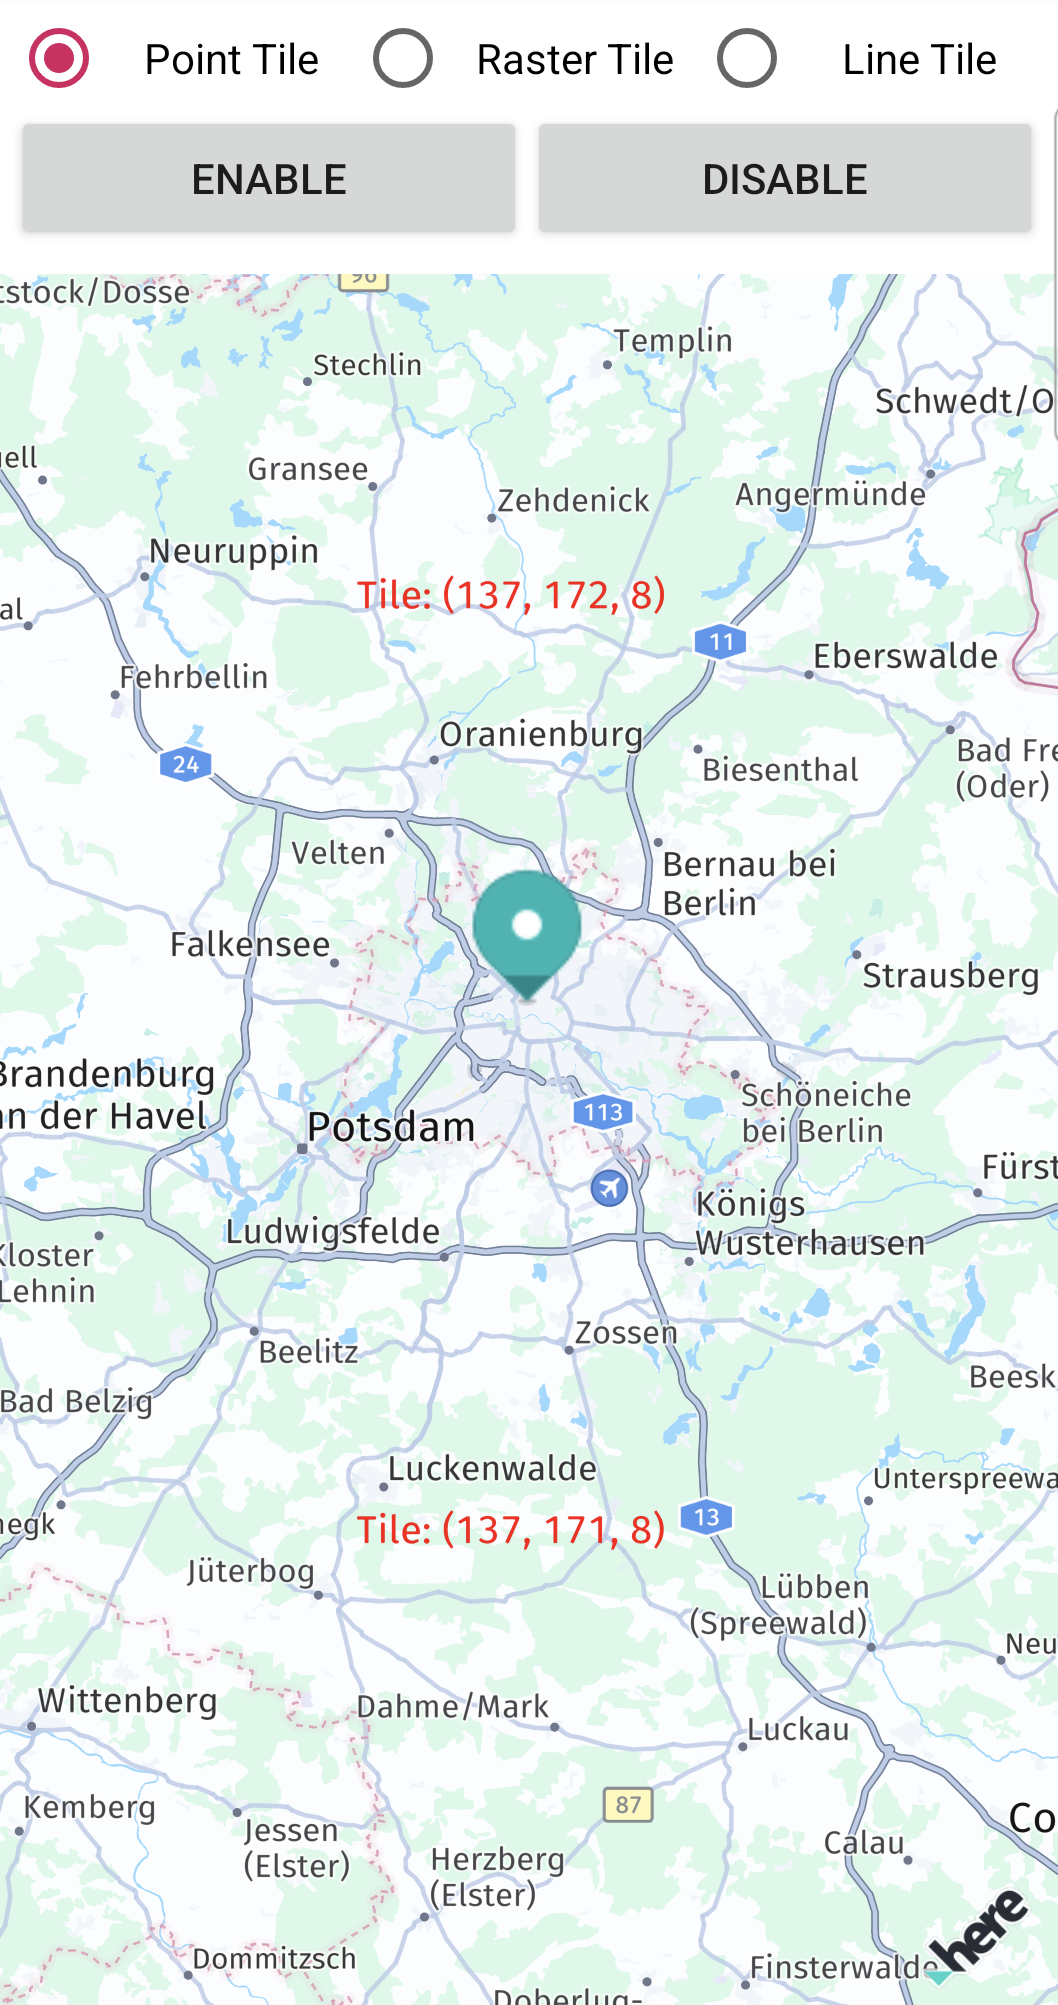
// named attribute "pointText" containing the tile key representation as a string.
DataAttributes pointAttributes = DataAttributesBuilder()
.withString("pointText", 'Tile: (${tileKey.x}, ${tileKey.y}, ${tileKey.level})')
.build();
PointData tileData = PointDataBuilder().withCoordinates(getTileCenter(tileKey))
.withAttributes(pointAttributes)
.build();
completionHandler.loaded(tileKey, [tileData], TileSourceTileMetadata(dataVersion, DateTime(0)));
// No request handle is returned here since there is no asynchronous loading happening.
return null;
}Prepare a custom style for your point tile source:
NoteThe
layervalue in the style string must match the name given to the MapLayer in the next steps. In this example, thedataSourceNameused isMyPointTileDataSourceand the layer nameMyPointTileDataSourceLayer.
final _pointLayerStyle = """
{
    "styles": [
        {
            "layer": "MyPointDataSourceLayer",
            "technique": "icon-text",
            "attr": {
                "text-color": "#ff0000ff",
                "text-size": 30,
                "text": ["get", "pointText"]
            }
        }
    ]
}
""";
To display a pointTileSource on top of a map, a MapLayer can be built:
// Creates a MapLayer for displaying custom point tiles.
MapLayer _createMapLayer(String dataSourceName) {
  // The layer should be visible for all zoom levels. The minimum tilt level is 0 and maximum zoom level is 23.
  MapLayerVisibilityRange range = MapLayerVisibilityRange(MapCameraLimits.minTilt, MapCameraLimits.maxZoomLevel);

  try {
    // Build and add the layer to the map.
    MapLayer mapLayer = MapLayerBuilder()
        .forMap(
            _hereMapController.hereMapControllerCore) // mandatory parameter
        .withName(dataSourceName + "Layer") // mandatory parameter
        .withDataSource(dataSourceName, MapContentType.point)
        .withStyle(JsonStyleFactory.createFromString(
            _pointLayerStyle)) // Creates a custom style for the point layer from the predefined JSON style string.
        .withVisibilityRange(range)
        .build();
    return mapLayer;
  } on MapLayerBuilderInstantiationException {
    throw Exception("MapLayer creation failed.");
  }
}
The resulting point tile source looks like this:
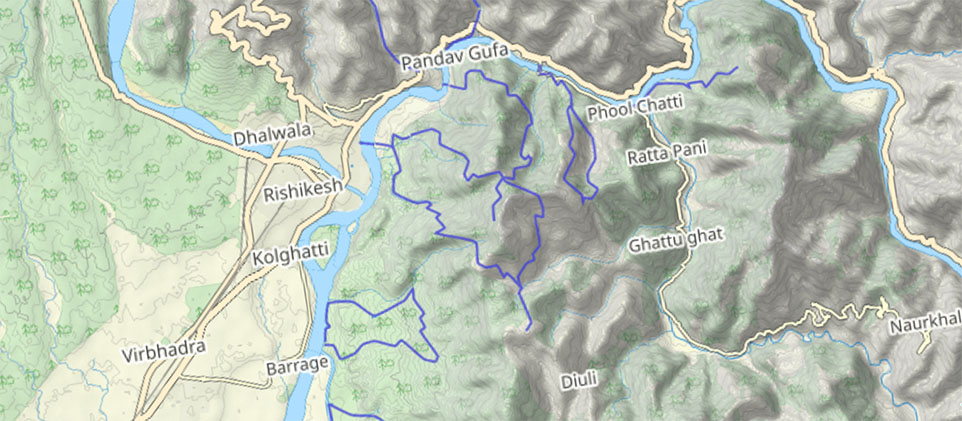
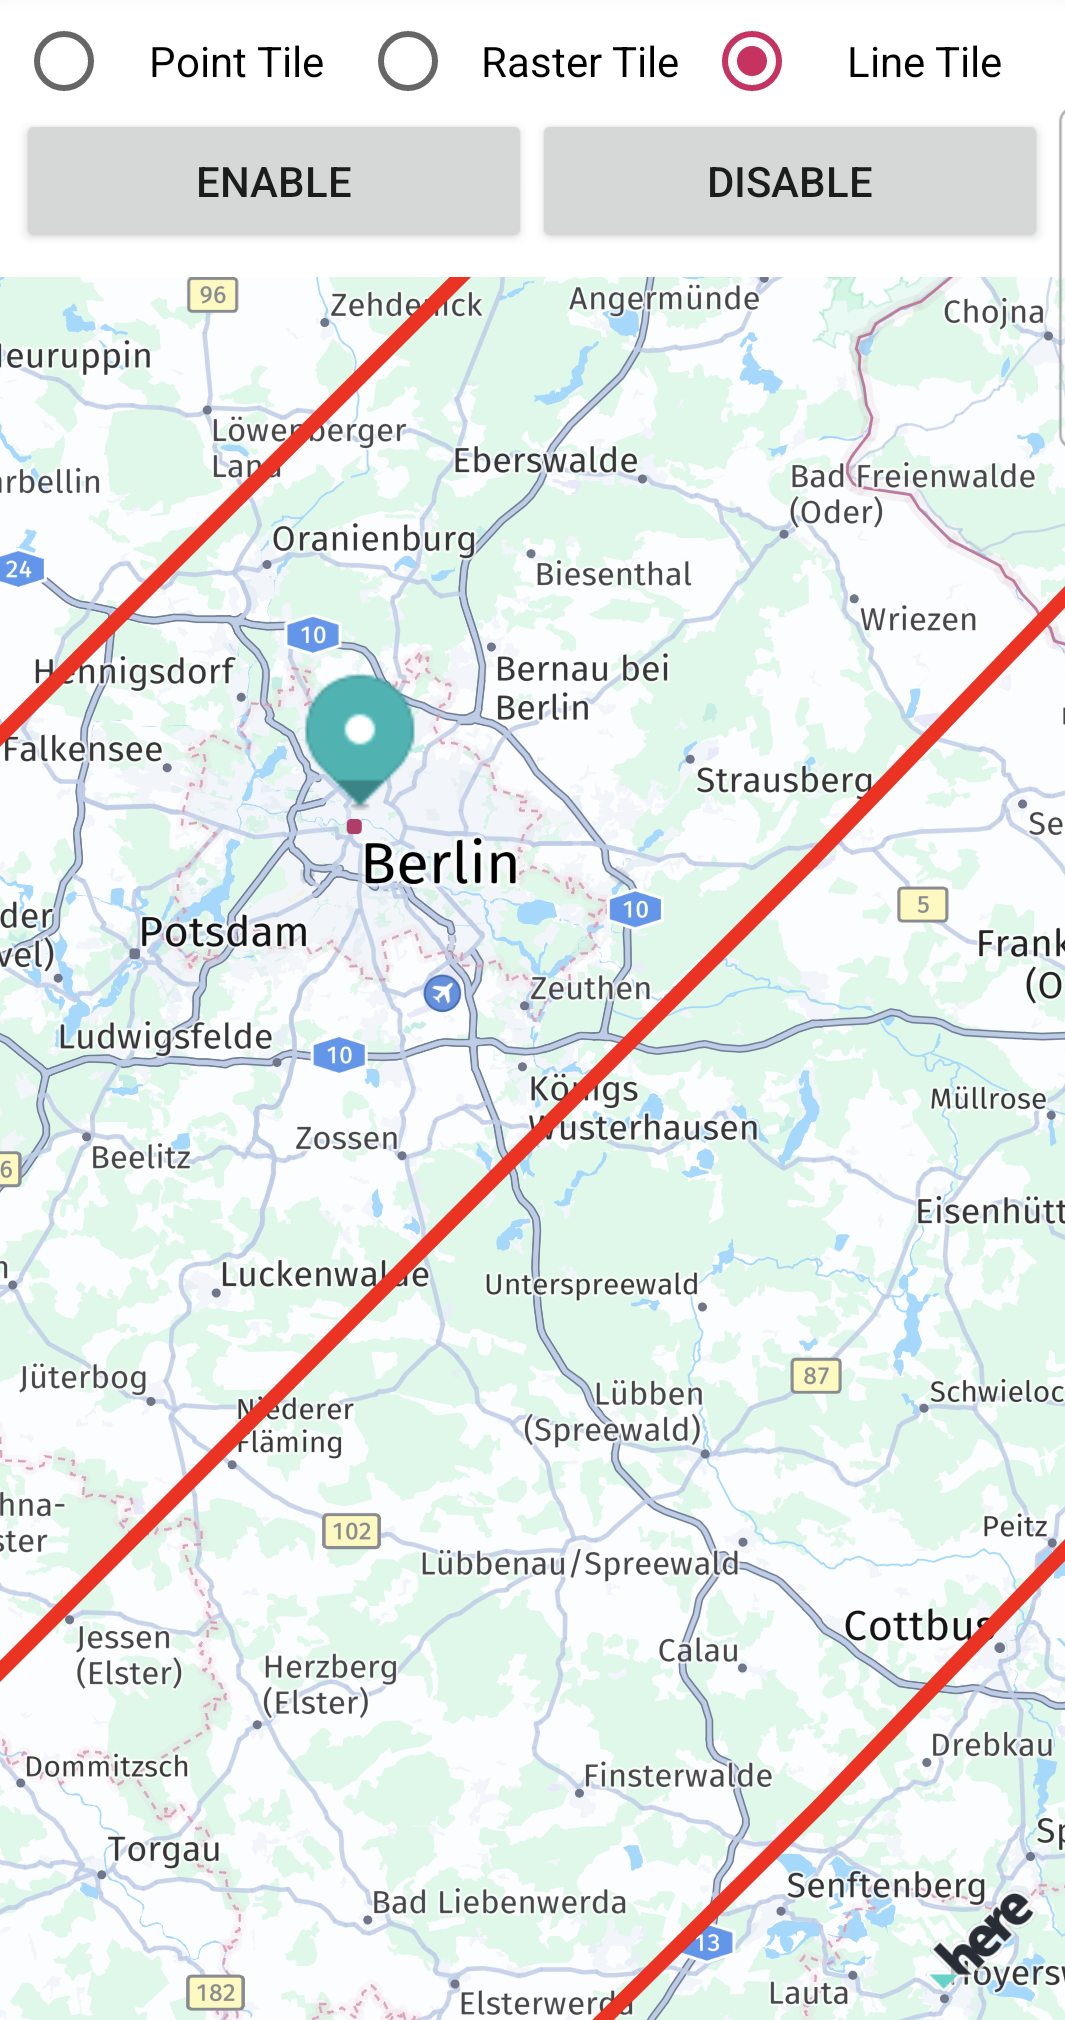
Add custom line tile source
You can enhance the map's appearance by adding a custom line tile source, allowing additional layers of line data to be rendered on top of the default HERE MapScheme. This approach enables seamless integration of line data, even when its format is not natively supported by the HERE SDK.
A Line Tile Data Source can be ideal for rendering off-road tracks, boundaries, etc.
NoteNote that this is a beta release of this feature, so there could be a few bugs and unexpected behaviors. Related APIs may change for new releases without a deprecation process.
To add a custom line tile source, you need to create a LineTileDataSource. The LineTileDataSource facilitates the creation of line tile sources, while LineTileSource provides a mechanism to supply custom line data based on the requested TileKey. It uses JSON-based styling to control the appearance of the custom line tile source and integrates it into the map.
On top of a LineTileDataSource, with MapLayerBuilder you can create a MapLayer to add a renderable map overlay to the map.
- Use
MapLayerVisibilityRangeto specify at which zoom levels the map layer should become visible. - Use the
MapContentTypeto specify the type of data to be shown by theMapLayer. In case of geodetic lines, useMapContentType.LINE. - Use the
StyleAPI to adjust properties such as icon at runtime.
Create a LineTileDataSource as follows:
HereMapController _hereMapController;
MapLayer? _lineMapLayer;
LineTileDataSource? _lineDataSource;

CustomLineTileSourceExample(this._hereMapController) {
  String dataSourceName = "MyLineTileDataSource";
  _lineDataSource = _createLineTileDataSource(dataSourceName);
  _lineMapLayer = _createMapLayer(dataSourceName);

  if (_lineMapLayer != null) {
    _lineMapLayer!.setEnabled(false);
    _lineMapLayer!.setStyle(_createCustomStyle());
  }

  double distanceToEarthInMeters = 60 * 1000;
  MapMeasure mapMeasureZoom =
  MapMeasure(MapMeasureKind.distanceInMeters, distanceToEarthInMeters);
  _hereMapController.camera.lookAtPointWithMeasure(
      GeoCoordinates(52.530932, 13.384915), mapMeasureZoom);
}
Create a custom line data source and load the tile:
LineTileDataSource _createLineTileDataSource(String dataSourceName) {
  var localLineTileSource = LocalLineTileSource();

  return LineTileDataSource.create(
      _hereMapController.mapContext, dataSourceName, localLineTileSource);
}

@override
TileSourceLoadTileRequestHandle? loadTile(
    TileKey tileKey, LineTileSourceLoadResultHandler completionHandler) {
  print("Loading tile for key: $tileKey");

  try {
    List<GeoCoordinates> lineCoordinates = getTileLineCoordinates(tileKey);

    if (lineCoordinates.isEmpty) {
      print("No line coordinates generated for tile: $tileKey");
      completionHandler.failed(tileKey);
      return null;
    }

    // Create the line tile data
    LineData tileData = LineDataBuilder()
        .withGeometry(GeoPolyline(lineCoordinates))
        .withAttributes(DataAttributesBuilder().build())
        .build();

    print("Tile loaded successfully");
    completionHandler.loaded(
        tileKey, [tileData], TileSourceTileMetadata(dataVersion, DateTime(0)));
  } catch (e) {
    print("Failed to create LineData: $e");
    completionHandler.failed(tileKey);
  }

  return null;
}
Prepare a custom style for your line tile source:
NoteThe
layervalue in the style string must match the name given to the MapLayer in the next steps. In this example, thedataSourceNameused isMyLineTileDataSourceand the layer nameMyLineTileDataSourceLayer.
final String _lineLayerStyle = '''
{
  "styles": [
    {
      "layer": "MyLineTileDataSourceLayer",
      "technique": "line",
      "attr": {
        "color": "#FF0000",
        "width": ["world-scale", 5]
      }
    }
  ]
}
''';

Style _createCustomStyle() {
  return JsonStyleFactory.createFromString(_lineLayerStyle);
}
To display a lineTileSource on top of a map, a MapLayer can be built:
MapLayer? _createMapLayer(String dataSourceName) {
  // The layer should be visible for all zoom levels. The minimum tilt level is 0 and maximum zoom level is 23.
  MapLayerVisibilityRange range = MapLayerVisibilityRange(MapCameraLimits.minTilt, MapCameraLimits.maxZoomLevel);

  try {
    return MapLayerBuilder()
        .forMap(_hereMapController.hereMapControllerCore)
        .withName("${dataSourceName}Layer")
        .withDataSource(dataSourceName, MapContentType.line)
        .withStyle(_createCustomStyle())
        .withVisibilityRange(range)
        .build();
  } on MapLayerBuilderInstantiationException catch (e) {
    print("Failed to create map layer: ${e.toString()}");
    return null;
  }
}
The resulting point tile source looks like this:
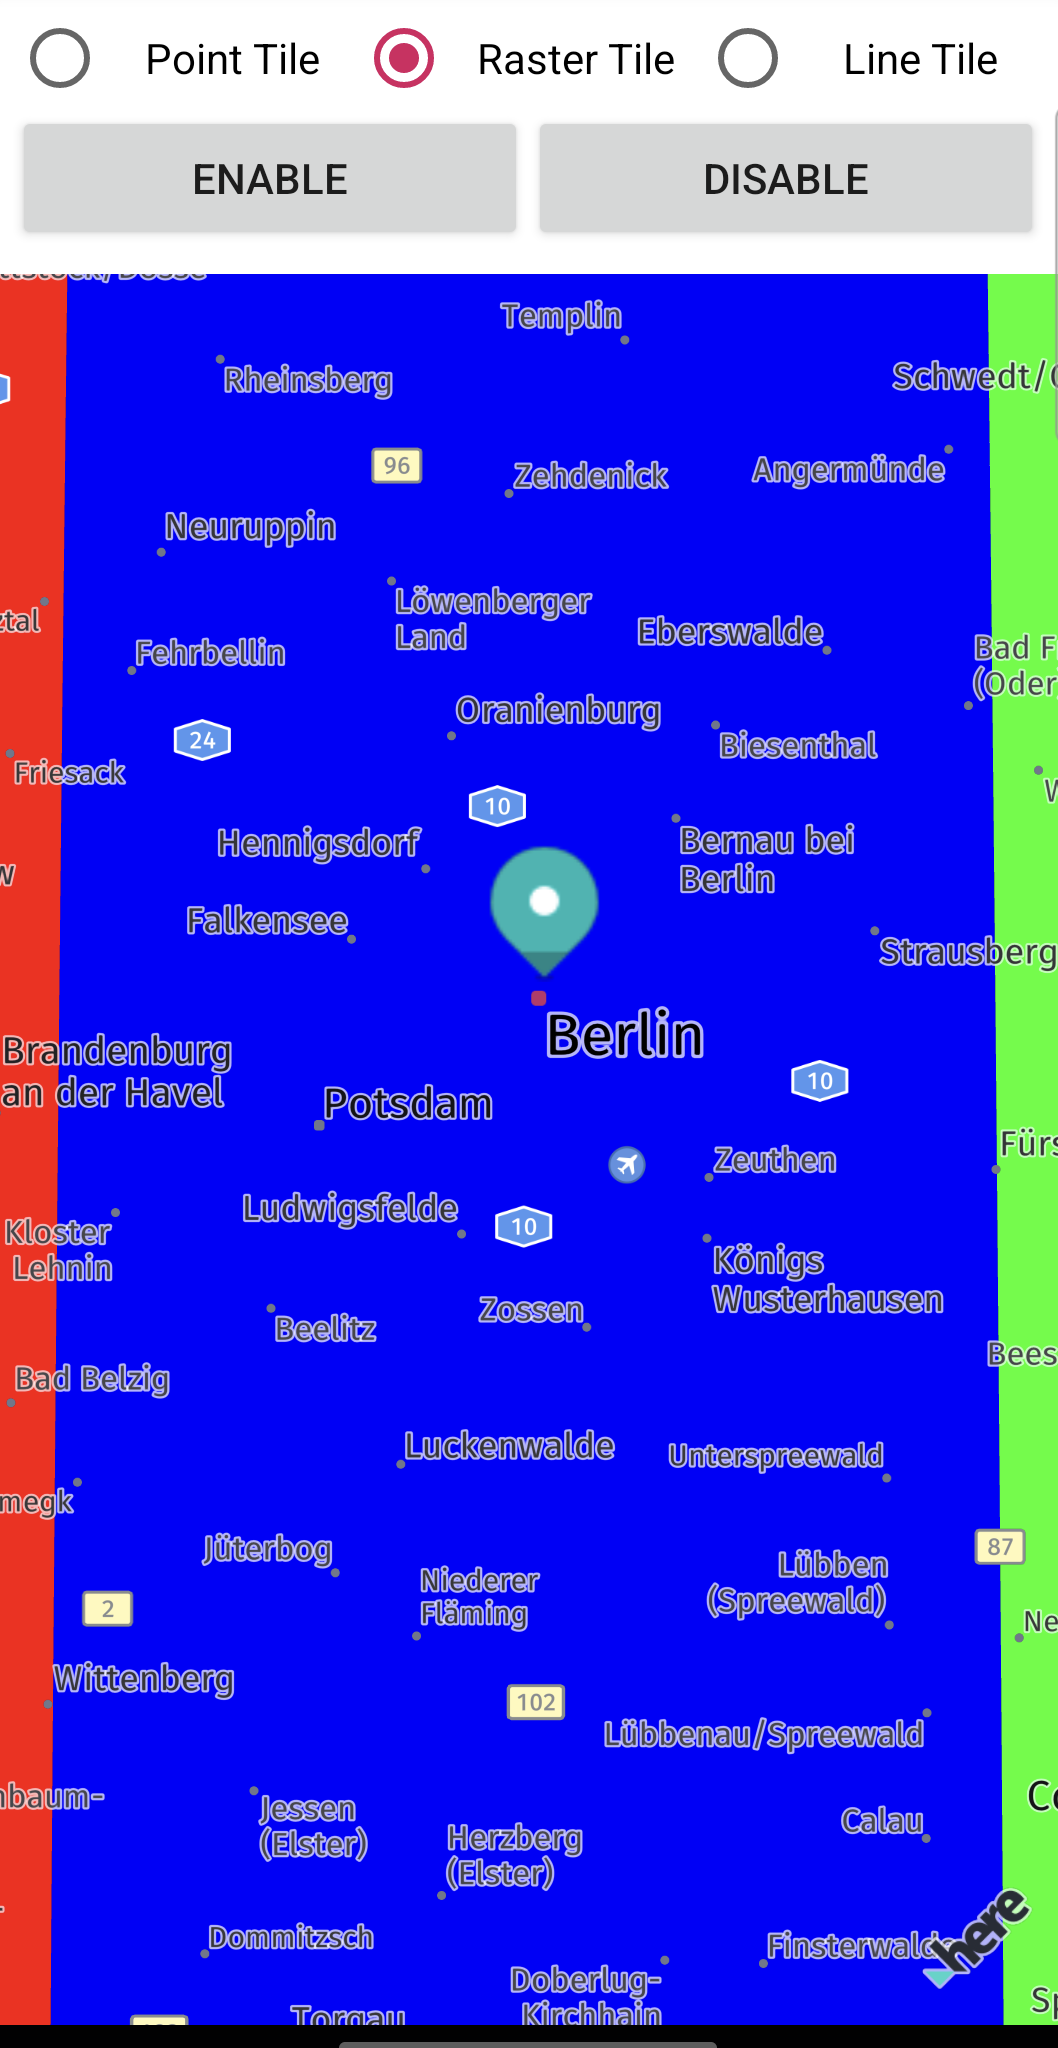
Add custom raster tile source
You can enhance the map's appearance by adding a custom raster tile source, allowing additional layers of raster data to be rendered on top of the default HERE MapScheme. This approach enables seamless integration of raster data, even when its format is not natively supported by the HERE SDK.
A Raster Tile Source can overlay image-based data such as satellite imagery, weather maps, etc.
NoteNote that this is a beta release of this feature, so there could be a few bugs and unexpected behaviors. Related APIs may change for new releases without a deprecation process.
To add a custom raster tile source, you need to create a RasterDataSource. The RasterDataSource facilitates the creation of raster data sources, while RasterTileSource provides a mechanism to supply custom raster data based on the requested TileKey. It uses JSON-based styling to control the appearance of the custom raster tile source and integrates it into the map.
On top of a RasterDataSource, with MapLayerBuilder you can create a MapLayer to add a renderable map overlay to the map.
- Use
MapLayerVisibilityRangeto specify at which zoom levels the map layer should become visible. - Use the
MapContentTypeto specify the type of data to be shown by theMapLayer. In case of geodetic rasters, useMapContentType.RASTER_IMAGE. - Use the
StyleAPI to adjust properties such as icon at runtime.
Create a RasterDataSource as follows:
HereMapController _hereMapController;
MapLayer? _rasterMapLayerStyle;
RasterDataSource? _rasterDataSourceStyle;

void setup() async {
  String dataSourceName = "myColorfulRasterDataSource";
  _rasterDataSourceStyle = await _createRasterDataSource(dataSourceName);
  _rasterMapLayerStyle = _createMapLayer(dataSourceName);

  // We want to start with the default map style.
  _rasterMapLayerStyle?.setEnabled(false);

  // Add a POI marker
  _addPOIMapMarker(GeoCoordinates(52.530932, 13.384915), 1);
}
Create a custom raster data source:
Future<RasterDataSource> _createRasterDataSource(
    String dataSourceName) async {
  var localRasterTileSource = LocalRasterTileSource();
  await localRasterTileSource.setupSource();

  // Note that this will make the raster source already known to the passed map view.
  return RasterDataSource.withTileSource(
      _hereMapController.mapContext, dataSourceName, localRasterTileSource);
}

@override
TileSourceLoadTileRequestHandle? loadTile(
    TileKey tileKey, RasterTileSourceLoadResultHandler completionHandler) {
  // Pick one of the local tile images, based on the tile key x component.

  completionHandler.loaded(tileKey, tileData[tileKey.x % tileData.length],
      TileSourceTileMetadata(dataVersion, DateTime(0)));

  // No request handle is returned here since there is no asynchronous loading happening.
  return null;
}
To display a rasterTileSource on top of a map, a MapLayer can be built:
MapLayer _createMapLayer(String dataSourceName) {
  // The layer should be rendered on top of other layers except the "labels" layer
  // so that we don't overlap the raster layer over POI markers.
  MapLayerPriority priority =
  MapLayerPriorityBuilder().renderedBeforeLayer("labels").build();

  // And it should be visible for all zoom levels. The minimum tilt level is 0 and maximum zoom level is 23.
  MapLayerVisibilityRange range = MapLayerVisibilityRange(MapCameraLimits.minTilt, MapCameraLimits.maxZoomLevel);

  try {
    // Build and add the layer to the map.
    MapLayer mapLayer = MapLayerBuilder()
        .forMap(
        _hereMapController.hereMapControllerCore) // mandatory parameter
        .withName(dataSourceName + "Layer") // mandatory parameter
        .withDataSource(dataSourceName, MapContentType.rasterImage)
        .withPriority(priority)
        .withVisibilityRange(range)
        .build();
    return mapLayer;
  } on MapLayerBuilderInstantiationException {
    throw Exception("MapLayer creation failed.");
  }
}
The resulting raster data source looks like this:
Note (only for Navigate)The creation of your custom road geometry or POIs requires HERE support and an additional agreement with HERE. Please contact your HERE representative for more details. See also Use custom map catalogs.
Try the example apps
Most of the code snippets mentioned above are available in our "custom_raster_layers_app" and "custom_tile_source_app" example apps. You can find these example apps on GitHub for your preferred platform.