

Visualize and update traffic on routes
Enhance your map applications with real-time traffic data using HERE SDK's advanced traffic features. Display live traffic flow and incidents on the map to keep users informed and help them navigate efficiently. Additionally, you can pick and highlight specific traffic incidents for a detailed view.
For the Navigate, you can also incorporate traffic information from radio stations.
Show real-time traffic flow and incidents on the map
You can easily visualize traffic incidents on the map by enabling the map layer state trafficIncidents. The HERE SDK also supports a separate layer to see the current traffic situation. See the example below for how to show or hide a layer on the map.
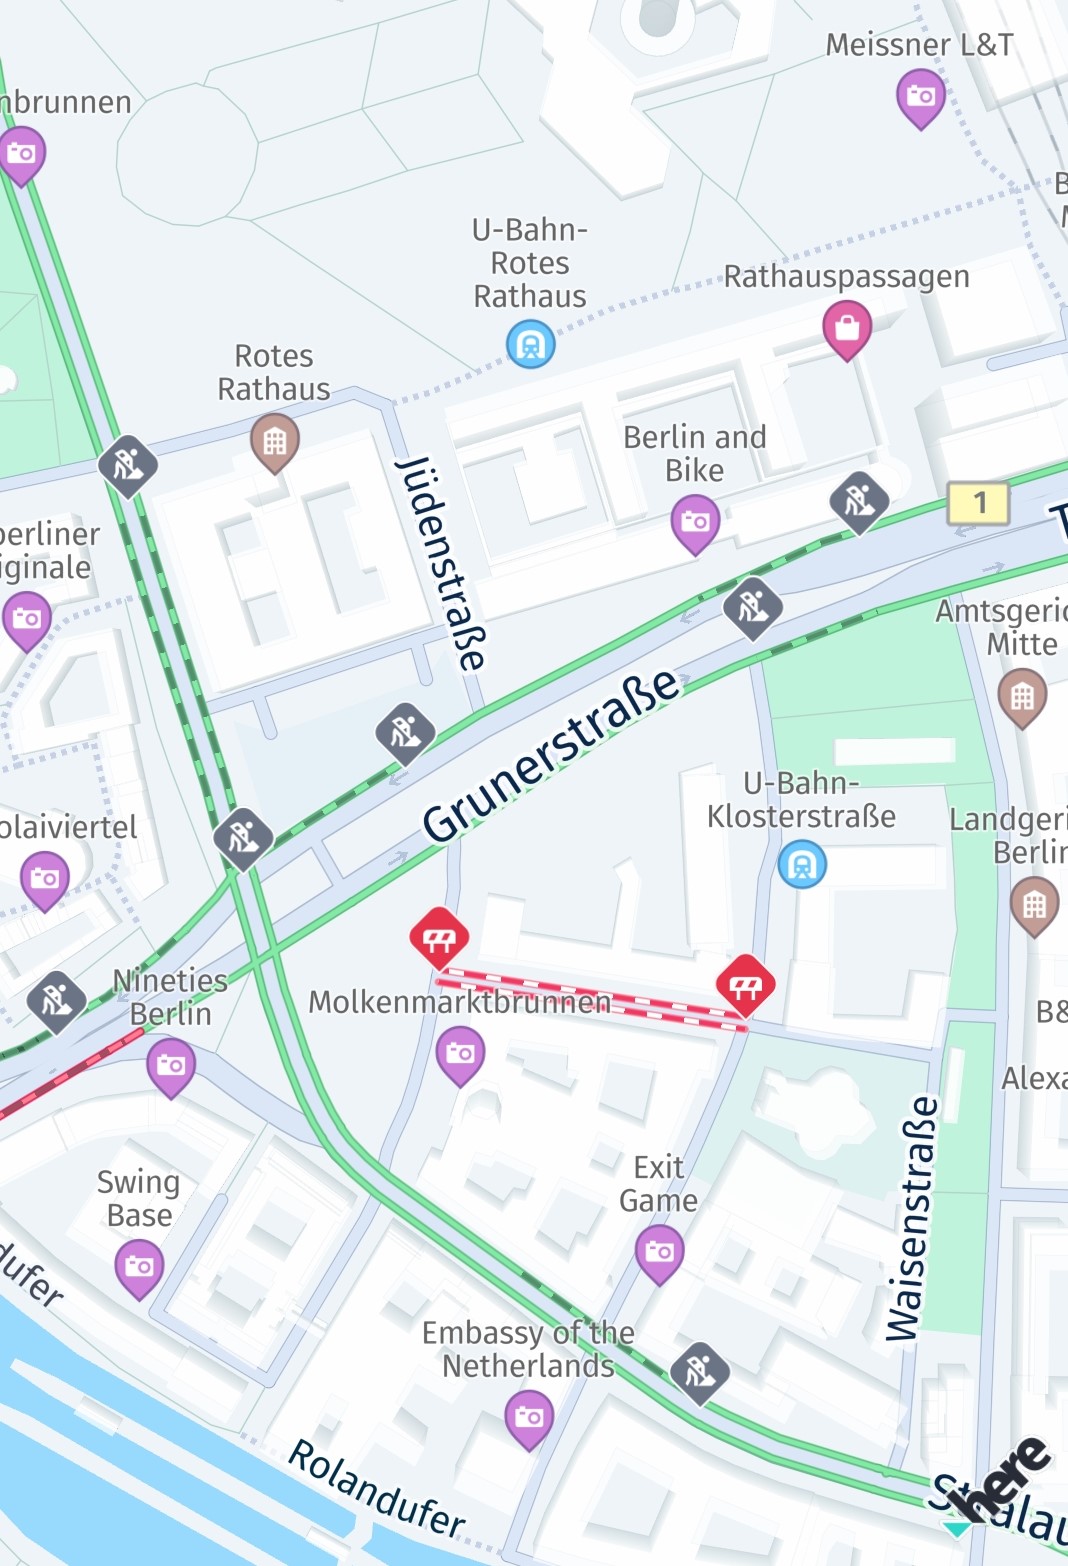
After a layer is set, the visible area of the map is automatically updated. So you can freely pan the map in all directions to see the latest traffic incidents.
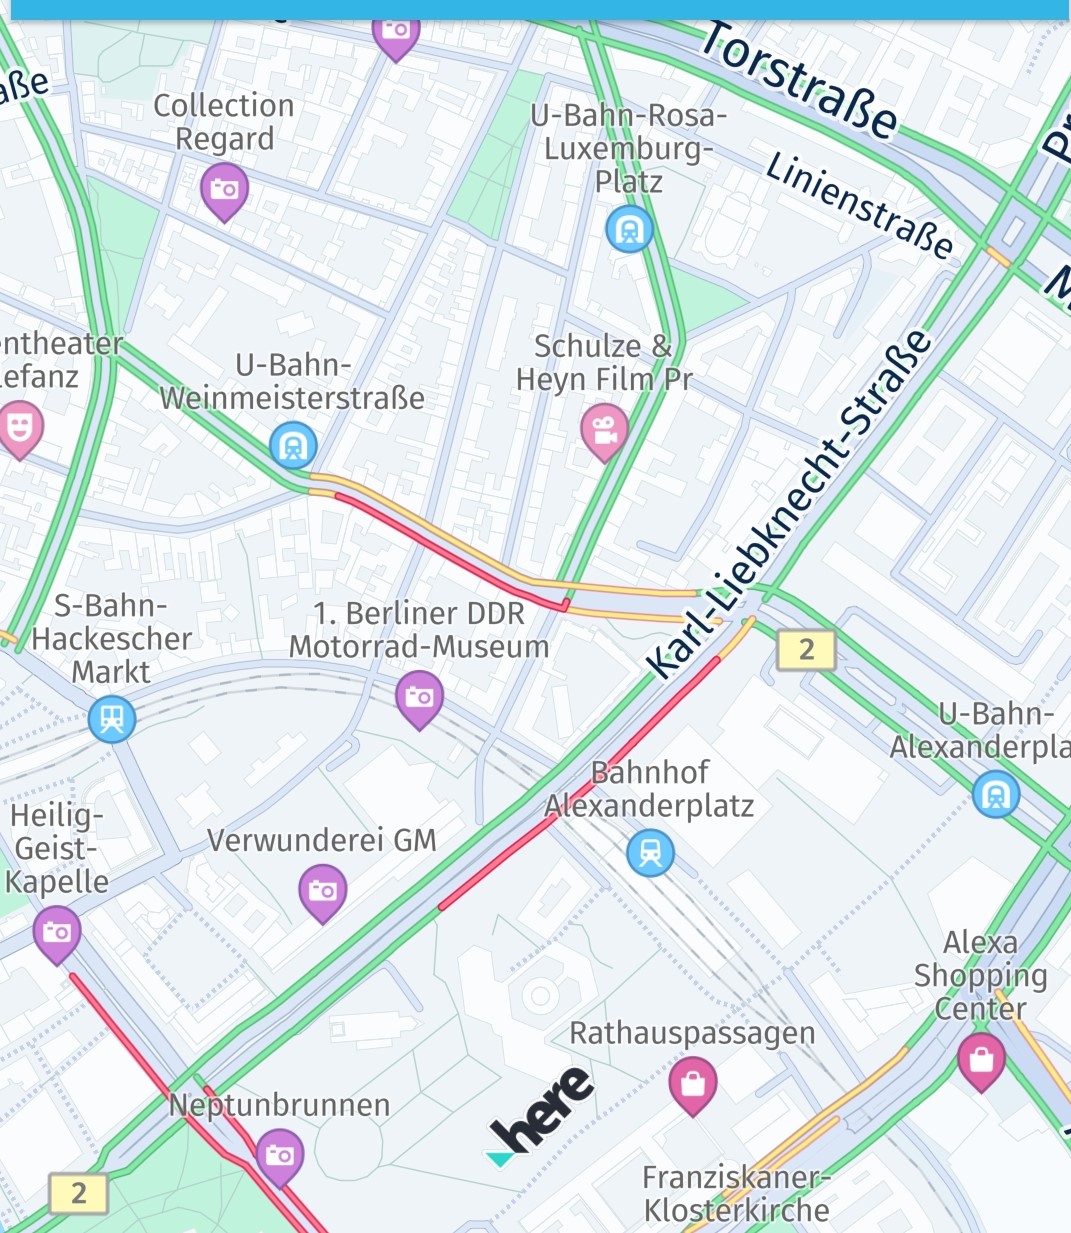
In many situations, drivers are interested in finding the fastest route based on the current traffic jams in a city - or outside a city. The HERE SDK allows you to show a layer holding all the current traffic jams, visualized by lines in different colors to indicate the severity of the jam - always updated in real-time. This feature requires an online connection and consumes slightly more data. However, the traffic lines are shown as part of the map tiles and are therefore highly performant.
Together - or independently - you can visualize such traffic information on the map with just a few lines of code:
func enableTrafficVisualization() {
    do {
        // Set the traffic flow refresh period to 5 * 60 seconds (5 minutes).
        // If MapFeatures.trafficFlow is disabled, no requests are made.
        //
        // Note: This code initiates periodic calls to the HERE Traffic backend. Depending on your contract,
        // each call may be charged separately. It is the application's responsibility to decide how
        // often this code should be executed.
        try MapContentSettings.setTrafficRefreshPeriod(5 * 60.0)
    } catch let error as MapContentSettings.TrafficRefreshPeriodError {
        print("TrafficRefreshPeriodError: \(error)")
    } catch {
        print("An unexpected error occurred: \(error)")
    }

    // Once these layers are added to the map, they will be automatically updated while panning the map.
    mapView.mapScene.enableFeatures([MapFeatures.trafficFlow : MapFeatureModes.trafficFlowWithFreeFlow])
    // MapFeatures.trafficIncidents renders traffic icons and lines to indicate the location of incidents.
    mapView.mapScene.enableFeatures([MapFeatures.trafficIncidents: MapFeatureModes.defaultMode])
}
Optionally, for MapFeatures.trafficFlow and MapFeatures.trafficIncidents you can also specify how often a request should be initiated in order to fetch the latest traffic data from the backend. Setting this via MapContentSettings.setTrafficRefreshPeriod(5 * 60.0) is most useful in a scenario where the map view remains static.
Regardless of the traffic refresh period setting, when a viewport change occurs, the HERE SDK may need to fetch new traffic data to render the updated viewport correctly.
Note
During turn-by-turn navigation, viewport changes can happen multiple times per second and may result in a high number of Traffic Vector Tile requests when these features are enabled. As an alternative, consider using TrafficOnRoute to update only the traffic visualization along the route itself.
For disabling the traffic layers, you can call:
mapView.mapScene.disableFeatures([MapFeatures.trafficFlow, MapFeatures.trafficIncidents])The traffic flow lines are color coded as follows:
- Green: Normal traffic
- Amber/Yellow: High traffic
- Red: Very high traffic
- Black: Blocking traffic
Pick traffic incidents
When the trafficIncidents is shown on the MapView, you can set up a tap handler and pick the traffic incidents to get more information.
// Conforming to TapDelegate protocol.
func onTap(origin: Point2D) {
    // Can be nil when the map was tilted and the sky was tapped.
    if let touchGeoCoords = mapView.viewToGeoCoordinates(viewCoordinates: origin) {
        tappedGeoCoordinates = touchGeoCoords

        // Pick incidents that are shown in trafficIncidents.
        pickTrafficIncident(touchPointInPixels: origin)
    }
}

// Traffic incidents can only be picked, when trafficIncidents is visible.
func pickTrafficIncident(touchPointInPixels: Point2D) {
    let originInPixels = Point2D(x: touchPointInPixels.x, y: touchPointInPixels.y)
    let sizeInPixels = Size2D(width: 1, height: 1)
    let rectangle = Rectangle2D(origin: originInPixels, size: sizeInPixels)

    mapView.pickMapContent(inside: rectangle, completion: onPickMapContent)
}

// MapViewBase.PickMapContentHandler to receive picked map content.
func onPickMapContent(mapContentResult: PickMapContentResult?) {
    if mapContentResult == nil {
        // An error occurred while performing the pick operation.
        return
    }

    let trafficIncidents = mapContentResult!.trafficIncidents
    if trafficIncidents.count == 0 {
        print("No traffic incident found at picked location")
    } else {
        print("Picked at least one incident.")
        let firstIncident = trafficIncidents.first!
        showDialog(title: "Traffic incident picked:", message: "Type: \(firstIncident.type.rawValue)")

        // Find more details by looking up the ID via TrafficEngine.
        findIncidentByID(firstIncident.originalId)
    }

    // Optionally, look for more map content like embedded POIs.
}
With the tap handler, we get the touched location in view coordinates that can be passed to mapView.pickMapContent(). Here, we just use a point-sized rectangle, but you can also enlarge the pick area to include more content at once.
The callback provides a PickMapContentResult which can contain a TrafficIncidentResult, but also other embedded types like default POI markers, that are always visible on the map. The TrafficIncidentResult type already provides most information about the incident, but to get all available information, we can use the TrafficEngine (see also below) to search for the picked incident by ID:
func findIncidentByID(_ originalId: String) {
    let trafficIncidentsLookupOptions = TrafficIncidentLookupOptions()
    // Optionally, specify a language:
    // the language of the country where the incident occurs is used.
    // trafficIncidentsLookupOptions.languageCode = LanguageCode.EN_US
    trafficEngine.lookupIncident(with: originalId,
                                 lookupOptions: trafficIncidentsLookupOptions,
                                 completion: onTrafficIncidentCompletion)
}

// TrafficIncidentCompletionHandler to receive traffic incidents from ID.
func onTrafficIncidentCompletion(trafficQueryError: TrafficQueryError?, trafficIncident: TrafficIncident?) {
    if trafficQueryError == nil {
        print("Fetched TrafficIncident from lookup request." +
                " Description: " + trafficIncident!.description.text)
    } else {
        showDialog(title: "TrafficLookupError:", message: trafficQueryError.debugDescription)
    }
}
A usage example is available on GitHub as part of the "Traffic" example app.
Get traffic broadcasts from radio stations (only available for Navigate)
With the TrafficDataProvider interface the HERE SDK allows to integrate radio station signals providing traffic broadcasts.
A TrafficBroadcast expects traffic data in the RDS-TMC format and can be used without an internet connection. In such cases, the OfflineRoutingEngine can utilize traffic data received over the radio channel, provided the rdsTraffic layer is enabled using LayerConfiguration. For more information on how to use LayerConfiguration, see here.
The trafficBroadcast.activate() method needs to be called to receive traffic data events.
A TrafficBroadcast continuously reacts to new locations provided from a location source and acts as a LocationListener. The location must be updated regardless of calling activate().
Note (only applicable for Navigate)
In order to adopt the interface special hardware is required. Talk to your HERE representative for more details. Note that this feature is released as a beta feature.
Update and visualize traffic on routes
Keep your routes up-to-date with the latest traffic conditions and visualize them on the map. This section explains how to refresh traffic data on existing routes, extract updated ETAs, visualize traffic along routes, and leverage dynamic routing during navigation to find better alternatives when traffic changes.
Update traffic information on routes
Use the option that best matches your scenario:
- When your use case is route preview and you only need to refresh traffic and ETA on the current route, then choose
calculateTrafficOnRoute(). It returns aTrafficOnRouteobject with traffic details perTrafficOnSectionandTrafficOnSpan(see Update traffic during route preview). - When your use case is updating an existing route instance with refreshed route data such as metadata or origin-related updates, then choose
refreshRoute()(see Update traffic during route preview). - When your use case is turn-by-turn navigation and you want to keep ETA updates on the current guided route, then choose
calculateTrafficOnRoute()together withvisualNavigator.trafficOnRoute(see Update traffic during turn-by-turn navigation and Update ETA and Traffic during navigation). - When your use case is finding a potentially better route while driving, including possible geometry changes due to current traffic, then choose
DynamicRoutingEngine(see Navigation). - When your use case is showing route traffic next to live traffic flow, then choose the adjacent polyline approach (see Render a polyline adjacent to traffic flow).
- When your use case is turn-by-turn route rendering with Navigate defaults, then choose
VisualNavigatorpolyline widths for consistent guidance visuals (see Render a polyline with the VisualNavigator (Navigate only)). - When your use case is custom on-route traffic visualization from predictive route data (for example by jam factor), then choose custom span rendering (see Render custom traffic along a route).
Note that calculateTrafficOnRoute() and refreshRoute() do not change the route distance and geometry.
Note (only applicable for Navigate)
Alternatively, you can use the
DynamicRoutingEngineto find improved routes during navigation. These routes are optimized based on the current traffic flow. As a result, they may also include new route geometry to bypass heavy traffic. For more details about theDynamicRoutingEngine, refer to the Navigation section.
Update traffic during route preview
The routingEngine.calculateTrafficOnRoute(..) method updates traffic on a specific section or an entire route after it has been created. It allows to calculated this during navigation or in a route preview context.
It does this by recalculating traffic from the last traveled route section, using its index and an offset (in meters) from the last visited position. In a route preview context you can set lastTraveledSectionIndex and traveledDistanceOnLastSectionInMeters to 0 in order to update traffic for the entire route.
Here's how the method can be utilized in screens primarily designed for route previews:
func updateTrafficOnRoute(route: Route?) {
    // Since traffic is being calculated for the entire route, lastTraveledSectionIndex and traveledDistanceOnLastSectionInMeters are set to 0.
    let lastTraveledSectionIndex = 0
    let traveledDistanceOnLastSectionInMeters = 0

    // Note: calculateTrafficOnRoute requires a route with routeHandle.
    // Enable it by setting routeOptions.enableRouteHandle to true when creating the route.
    routingEngine.calculateTrafficOnRoute(
        route: route!,
        lastTraveledSectionIndex: Int32(lastTraveledSectionIndex),
        traveledDistanceOnLastSectionInMeters: Int32(traveledDistanceOnLastSectionInMeters)
    ) { routingError, trafficOnRoute in
        if let error = routingError {
            print("CalculateTrafficOnRoute error: \(error)")
        } else if let trafficOnRoute = trafficOnRoute {
            self.showUpdatedETA(trafficOnRoute: trafficOnRoute)
        }
    }
}
The updated ETA from TrafficOnRoute is available through TrafficOnSpan. Each TrafficOnSpan provides traffic information along the route. The following method can be used to extract the updated ETA:
private func showUpdatedETA(trafficOnRoute: TrafficOnRoute) {
    for section in trafficOnRoute.trafficSections {
        var updatedETAInSeconds = 0.0;
        section.trafficSpans.forEach{ updatedETAInSeconds = updatedETAInSeconds + Double($0.duration)}
        var updatedTrafficDelayInSeconds = 0.0;
        section.trafficSpans.forEach{ updatedTrafficDelayInSeconds = updatedTrafficDelayInSeconds + Double($0.trafficDelay)}
        let updatedETAString = String(format: "Updated travel duration %@\nUpdated traffic delay %@",
                                      timeUtils.formatTime(sec: updatedETAInSeconds),
                                      timeUtils.formatTime(sec: updatedTrafficDelayInSeconds))
        showDialog(title: "Updated traffic", message: updatedETAString)
    }
}Note
Traffic updates use predictive models to forecast conditions along your route, which may differ from real-time traffic shown on map layers. For details on these differences, see Traffic.
Update traffic during turn-by-turn navigation (only available for Navigate)
For guidance-specific traffic updates with visualNavigator.trafficOnRoute, including a periodic calculateTrafficOnRoute() example, see Update ETA and Traffic during navigation.
Visualize traffic on routes
The HERE SDK enables you to visualize traffic conditions directly on route polylines. You can choose between two approaches: rendering routes adjacent to the real-time traffic flow layer on the map, or drawing custom traffic overlays using predictive traffic data from the route itself.
To understand the difference between real-time and predictive traffic data sources and when to use each approach, see Traffic.
Render a polyline adjacent to traffic flow
By default, the HERE SDK provides the color encoding used for the traffic flow layer which indicates traffic conditions. Using MapMeasureDependentRenderSize, you can define the rendering width of your polyline based on the MapMeasure.Kind so that it renders adjacent to these traffic polylines.
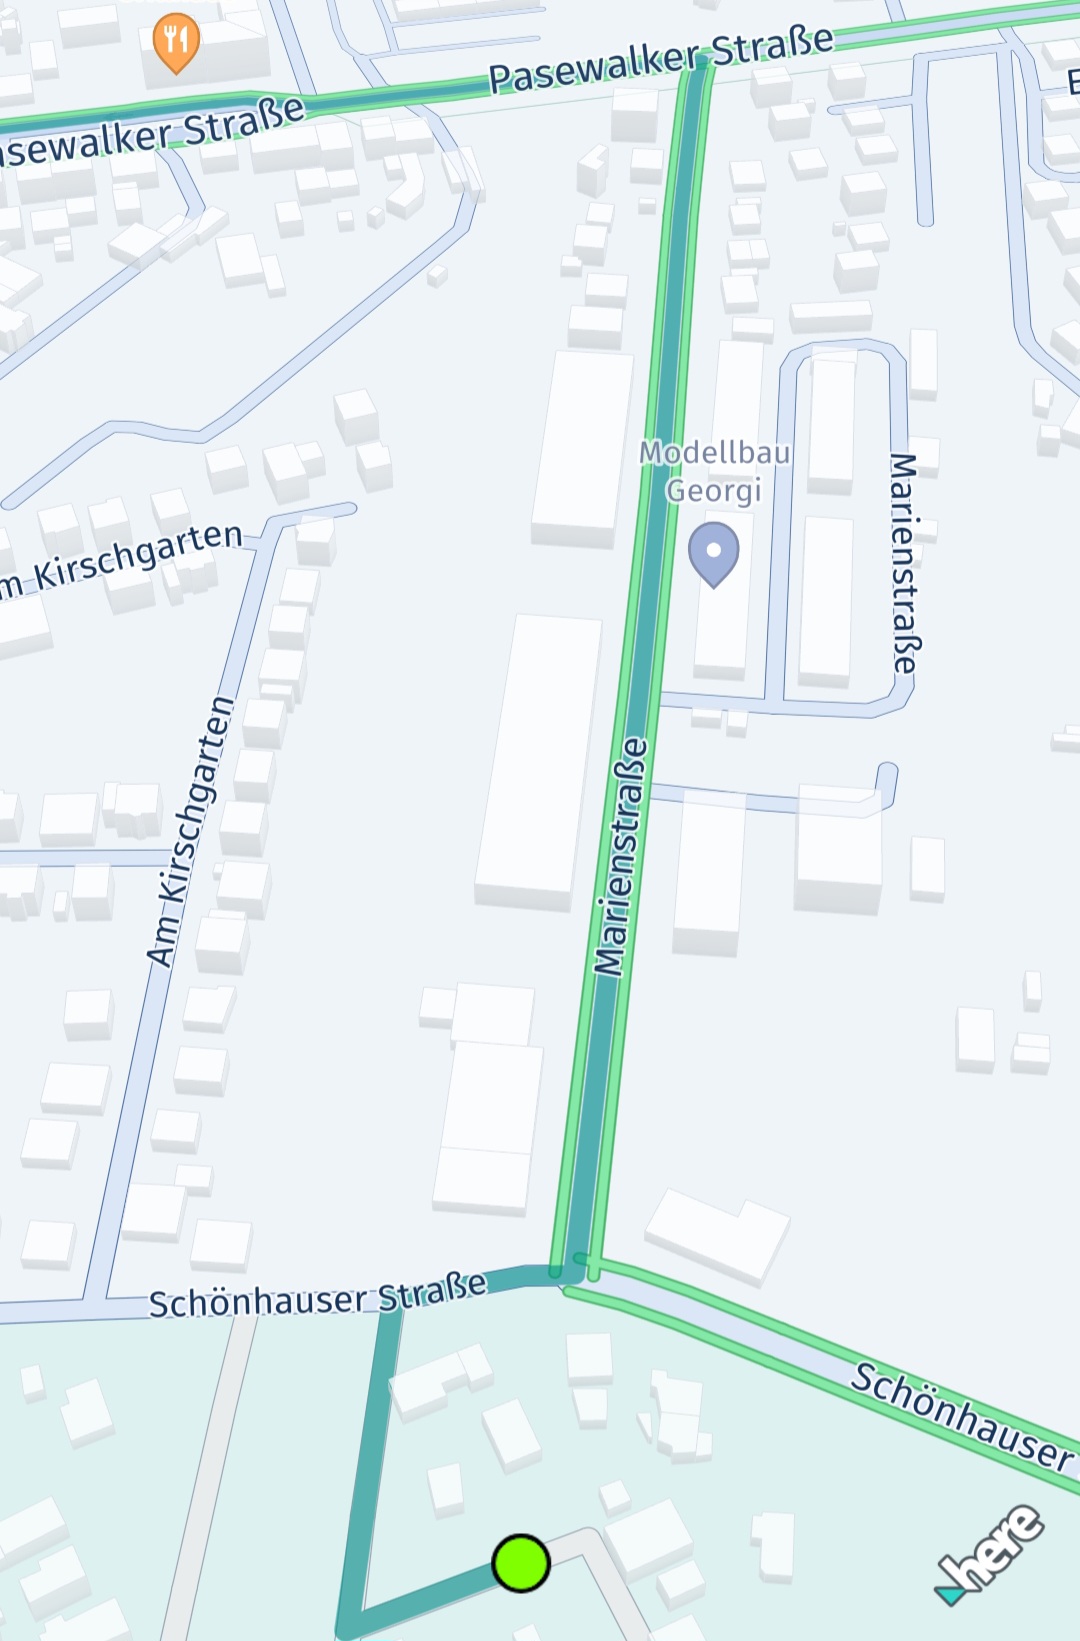
Here's an example to implement it:
// Show route as polyline.
let routeGeoPolyline = route.geometry
let polylineColor = UIColor(red: 0.051, green: 0.380, blue: 0.871, alpha: 1)
let outlineColor = UIColor(red: 0.043, green: 0.325, blue: 0.749, alpha: 1)
do {
    // Below, we're creating an instance of MapMeasureDependentRenderSize. This instance will use the scaled width values to render the route polyline.
    // We can also apply the same values to MapArrow.setMeasureDependentTailWidth().
    // The parameters for the constructor are: the kind of MapMeasure (in this case, ZOOM_LEVEL), the unit of measurement for the render size (PIXELS), and the scaled width values.
    let mapMeasureDependentLineWidth = try MapMeasureDependentRenderSize(measureKind: MapMeasure.Kind.zoomLevel, sizeUnit: RenderSize.Unit.pixels, sizes: getDefaultLineWidthValues())

    // We can also use MapMeasureDependentRenderSize to specify the outline width of the polyline.
    let outlineWidthInPixel = 1.23 * mapView.pixelScale
    let mapMeasureDependentOutlineWidth = try MapMeasureDependentRenderSize(sizeUnit: RenderSize.Unit.pixels, size: outlineWidthInPixel)
    let routeMapPolyline = try MapPolyline(geometry: routeGeoPolyline,
                                            representation: MapPolyline.SolidRepresentation(
                                                lineWidth: mapMeasureDependentLineWidth,
                                                color: polylineColor,
                                                outlineWidth: mapMeasureDependentOutlineWidth,
                                                outlineColor: outlineColor,
                                                capShape: LineCap.round))

    mapView.mapScene.addMapPolyline(routeMapPolyline)
    mapPolylineList.append(routeMapPolyline)
} catch let error {
    fatalError("Failed to render MapPolyline. Cause: \(error)")
}
The width values specified for MapMeasureDependentRenderSize are linearly interpolated between each successive pair of data points. It can be generated like this:
// Returns a dictionary where the key is the zoom level and the value is the corresponding scaled width.
private func getDefaultLineWidthValues() -> [Double:Double] {
    var widthsPerZoomLevel : [Double:Double] = [:]
    let pixelScale = mapView.pixelScale
    // Here width value will remain 2.18 from 0.0 zoom level to 6.0.
    // From 6.0 the updated value 2.48 will be used.
    widthsPerZoomLevel[0.0] = 2.18 * pixelScale
    widthsPerZoomLevel[6.0] = 2.48 * pixelScale
    widthsPerZoomLevel[7.0] = 2.78 * pixelScale
    widthsPerZoomLevel[11.0] = 3.1 * pixelScale
    widthsPerZoomLevel[16.0] = 3.15 * pixelScale
    widthsPerZoomLevel[17.0] = 3.35 * pixelScale
    widthsPerZoomLevel[18.0] = 3.78 * pixelScale
    widthsPerZoomLevel[19.0] = 6.5 * pixelScale
    widthsPerZoomLevel[20.0] = 10.2 * pixelScale
    widthsPerZoomLevel[24.0] = 77.5 * pixelScale
    return widthsPerZoomLevel
}
Render a polyline with the VisualNavigator (Navigate only)
During turn-by-turn guidance you can use the default values from VisualNavigator which can be retrieved using defaultRouteManeuverArrowMeasureDependentWidths. Further scaling the width values will enable a clean and persistent look across various devices.
// Retrieves the default widths of a route polyline and maneuver arrows from VisualNavigator,
// scaling them based on the screen's pixel density.
private func getDefaultLineWidthValues() -> [Double:Double] {
    var widthsPerZoomLevel: [Double: Double] = [:];
    for defaultValues in VisualNavigator.defaultRouteManeuverArrowMeasureDependentWidths() {
            let key = defaultValues.key.value
            let value = defaultValues.value * mapView.pixelScale
            widthsPerZoomLevel[key] = value
        }
    return widthsPerZoomLevel
}
Render custom traffic along a route
As an alternative to rendering the route's polyline adjacent to traffic flow, you can also render the traffic yourself utilizing the traffic data available as part of the Route object. This can be useful during route preview use cases, before starting actual guidance.
Note that this approach may be perceived as less accurate because the traffic information includes predictive data from the route instead of the real-time information provided by the traffic flow schemes. However, similar to the color encoding used for the traffic flow layer, you can indicate the traffic along a route using dynamicSpeedInfo.calculateJamFactor() that ranges from 0 (no traffic) to 10 (road is blocked). Each Section of a Route can contain various DynamicSpeedInfo instances. These are valid along the Span until the next Span. Each Span geometry is represented by a polyline that is part of the full route's polyline shape.
The following code snippet shows how to get a DynamicSpeedInfo element of the first Span of a Section:
let firstSection = route.sections[0]
let dynamicSpeed = firstSection.spans[0].dynamicSpeedInfo
DynamicSpeedInfo contains the baseSpeedInMetersPerSecond, which is the expected default travel speed. Note that this may not be the same as the current speed limit on a road - as a bad road condition may justify a slower travel speed. In addition, you can get the estimated actual travel speed based on the current traffic conditions with trafficSpeedInMetersPerSecond.
An example how this value can be mapped to a suitable color is shown below:
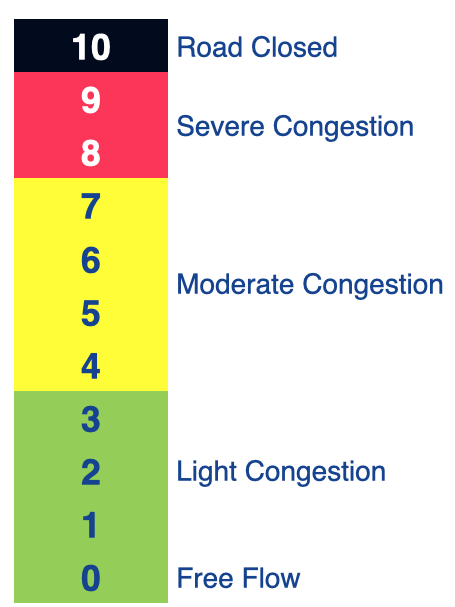
Usually, the jam factor can be interpreted like this:
- 0 <= jam factor < 4: No or light traffic.
- 4 <= jam factor < 8: Moderate or slow traffic.
- 8 <= jam factor < 10: Severe traffic.
- jam factor = 10: No traffic, that is the road is blocked.
Note
Note that the jam factor you can get from
DynamicSpeedInfois calculated piecewise-linear from the ratio oftrafficSpeedInMetersPerSecond/baseSpeedInMetersPerSecond- without taking road types and other parameters into account. Therefore, the provided jam factor does not necessarily match exactly the traffic flow visualization on the map view (if enabled). On top, theRoutingEngineuses predictive location services to predict upcoming traffic while traversing the route - whereas the traffic flow visualization represents only the current point in time (real time). Also, worth to mention, the prerendered traffic flow may use a different color representation based on the current zoom level.It is an app decision whether to prefer predicted traffic along a route that matches the given ETA - or to show instead the real-time traffic situation, which might not be accurate any more when reaching a destination in the future.
The recommended approach for the latter is to show the route and the traffic-flow side-by-side by using a map-measure dependent width for the route's polyline - instead of rendering the traffic additionally on the route itself.
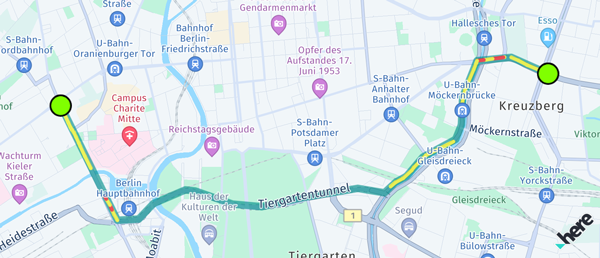
If you want to visualize the traffic along a route, consider rendering multiple colored MapPolyline objects for each span of a section:
// This renders the traffic jam factor on top of the route as multiple MapPolylines per span.
private func showTrafficOnRoute(_ route: Route) {
    if route.lengthInMeters / 1000 > 5000 {
        print("Skip showing traffic-on-route for longer routes.")
        return
    }

    for section in route.sections {
        for span in section.spans {
            let dynamicSpeedInfo: DynamicSpeedInfo? = span.dynamicSpeedInfo
            guard let lineColor = getTrafficColor(dynamicSpeedInfo?.calculateJamFactor()) else {
                // Skip rendering low traffic.
                continue
            }

            let widthInPixels = 10.0
            do {
                let trafficSpanMapPolyline = try MapPolyline(geometry: span.geometry,
                                                  representation: MapPolyline.SolidRepresentation(
                                                    lineWidth: try MapMeasureDependentRenderSize(
                                                        sizeUnit: RenderSize.Unit.pixels,
                                                        size: widthInPixels),
                                                    color: lineColor,
                                                    capShape: LineCap.round))

                mapView.mapScene.addMapPolyline(trafficSpanMapPolyline)
                mapPolylineList.append(trafficSpanMapPolyline)
            } catch let error {
                fatalError("Failed to render MapPolyline. Cause: \(error)")
            }
        }
    }
}

// Define a traffic color scheme based on the route's jam factor.
// 0 <= jamFactor < 4: No or light traffic.
// 4 <= jamFactor < 8: Moderate or slow traffic.
// 8 <= jamFactor < 10: Severe traffic.
// jamFactor = 10: No traffic, that is the road is blocked.
// Returns nil in case of no or light traffic.
private func getTrafficColor(_ jamFactor: Double?) -> UIColor? {
    guard let jamFactor = jamFactor else {
        return nil
    }
    if jamFactor < 4 {
        return nil
    } else if jamFactor >= 4 && jamFactor < 8 {
        return UIColor(red: 1, green: 1, blue: 0, alpha: 0.63) // Yellow
    } else if jamFactor >= 8 && jamFactor < 10 {
        return UIColor(red: 1, green: 0, blue: 0, alpha: 0.63) // Red
    }
    return UIColor(red: 0, green: 0, blue: 0, alpha: 0.63) // Black
}
Note that we skip traffic rendering for longer routes due to performance reasons - since in this example each span with traffic is rendered as a separate polyline.
Updated 13 days ago