Use geoshapes
The HERE Maps API for JavaScript offers a convenient way to highlight and demarcate areas on the map using circles, rectangles, polylines, and polygons, also referred to as spatials. You can draw these shapes directly onto an online map, much like you would with a pencil or pen on paper. The API offers great flexibility and a broad range of options for defining the colors, line thickness, and transparency of shapes. Additionally, spatial features allow for precise placement of each shape with accurate geographic precision.
Common spatial features
Learn about the most common types of spatial features in the HERE Maps API for JavaScript: polylines, polygons, rectangles, and circles.
A polyline (H.map.Polyline) is a line on the map defined by a set of points (represented in the API as a H.geo.LineString) and a style that specifies how the Maps API renders the line on the map. Polyline instances can be used to draw paths similar to routes.
A polygon (H.map.Polygon) is similar to a polyline, except it represents a closed shape. As such, polygons are useful for highlighting or showing an area on the map. Unlike polyines, which do not have an outline or fill color by default, polygons can be traced with an optional outline and filled with an arbitrary color.
Rectangles (H.map.Rect) and circles (H.map.Circle) are specialized polygon types, building upon the fundamental geometry of polygons.
To display a geographic shape, you must create an instance of the relevant API class and then add the resulting object to the Map object, as demonstrated in the subsequent sections.
Note
The following sections build upon the base map described in Get started with HERE Maps API for JavaScript as the foundation for introducing code additions.
Draw a circle on the map
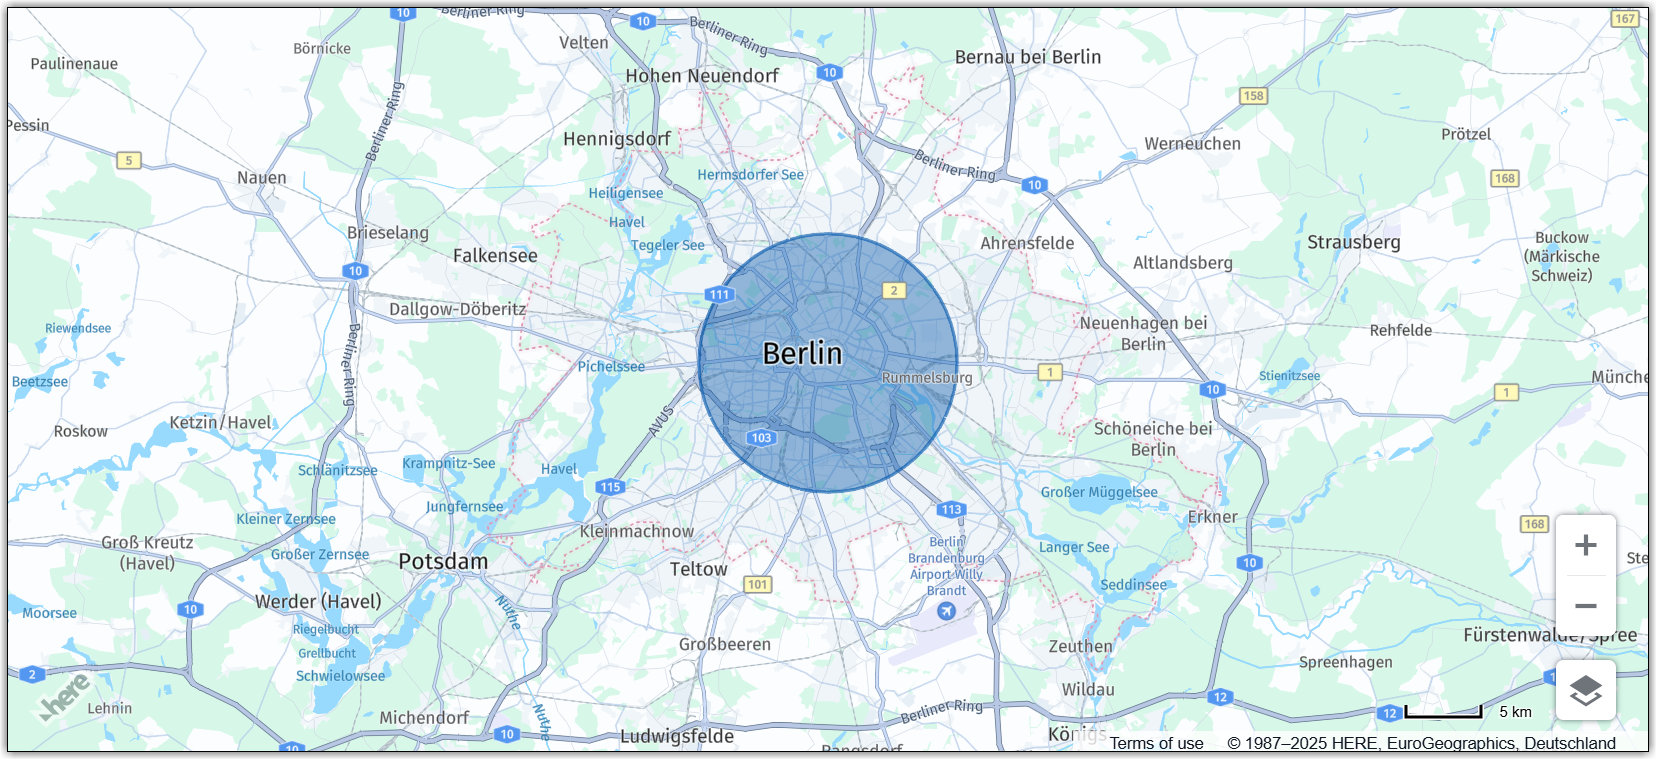
The following example demonstrates how to add a circle to the map.
// Instantiate a circle object (using the default style):
var circle = new H.map.Circle({lat: 52.51, lng: 13.4}, 8000);

// Add the circle to the map:
map.addObject(circle);
The code in the preceding example instantiates a circle, providing the latitude and longitude of its center and the radius, and finally adds the circle to the map.
The following figure shows the resulting map:
Style spatial features
The Maps API for JavaScript enables customization of the visual appearance of geographic shapes through styling. The available customization options include:
| Style property | Description |
|---|---|
strokeColor | The color of a shape's outline |
lineWidth | The width of the outline in pixels |
fillColor | The color with which a shape's area will be filled (ignored for polylines) |
lineDash | The length of the dashes and gaps in a polyline |
For more information about the style properties you can apply to geo shapes, see the H.map.SpatialStyle class documentation in the API Reference.
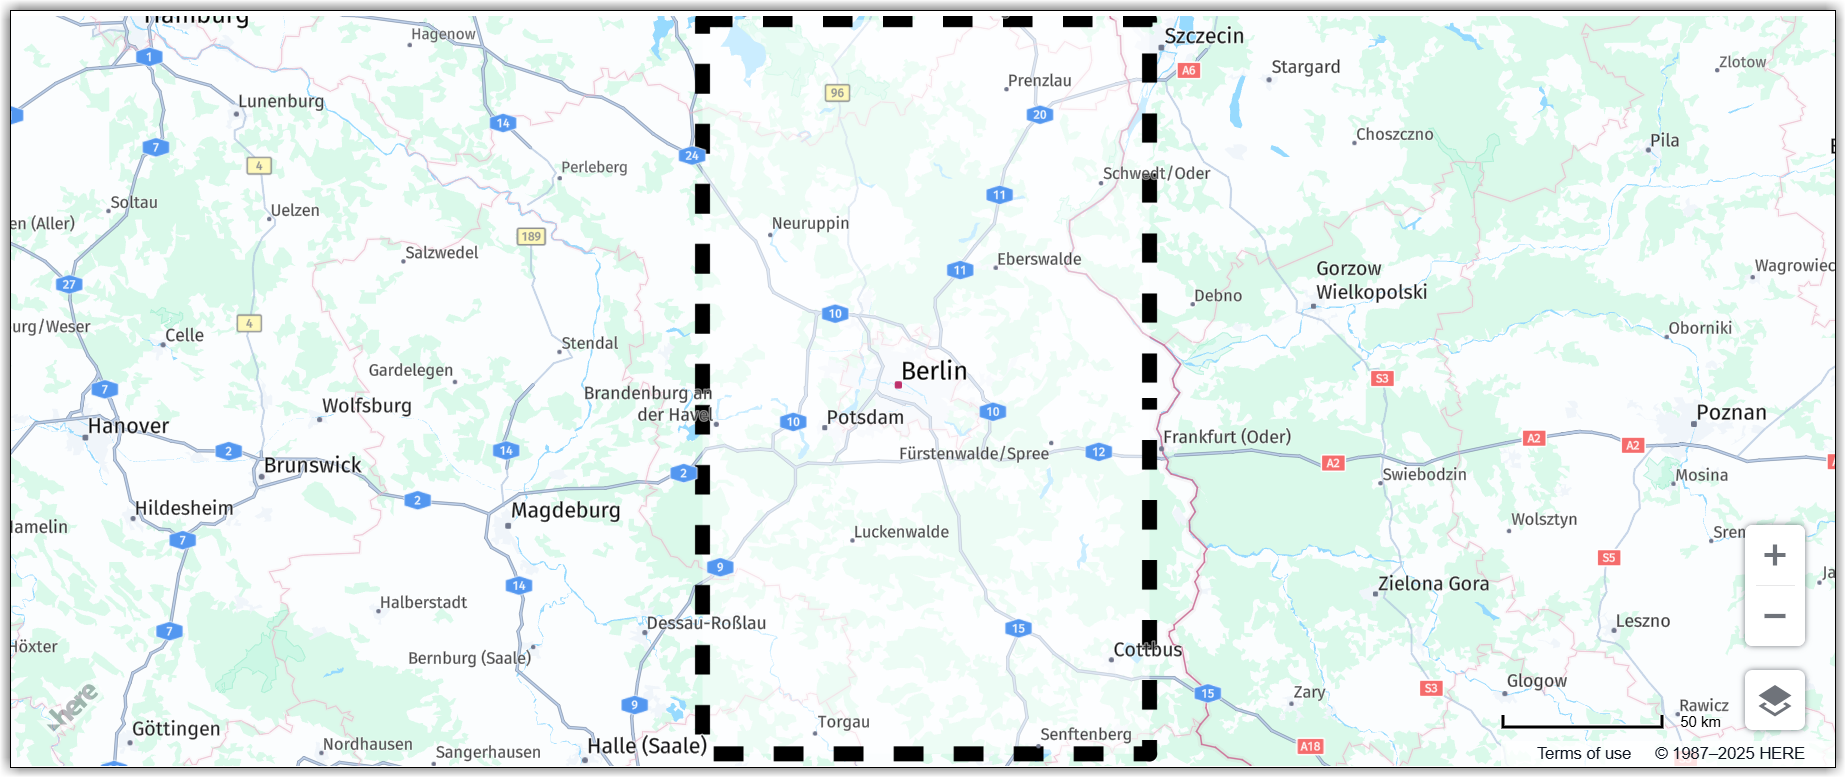
The following example shows how to apply custom styling to a rectangle object.
// Create a style object:
var customStyle = {
  strokeColor: 'black',
  fillColor: 'rgba(255, 255, 255, 0.5)',
  lineWidth: 10,
  lineDash: [2, 2]
};

// Create a rectangle and pass the custom style as an options parameter:
var rect = new H.map.Rect(new H.geo.Rect(53.5, 12.5, 51.5, 14.5),
  { style: customStyle });

// Add the rectangle to the map:
map.addObject(rect);

// Zoom the map to fit the rectangle:
map.getViewModel().setLookAtData({bounds: rect.getBoundingBox()});
The code from the previous example creates three key objects:
- An object holding styling details, including stroke and fill colors, as well as line properties.
- An instance of a rectangle, specifying its geographic coordinates (that is, the coordinates of its corners) and providing a style object reference.
- The last two function calls add the rectangle to the map and set the map view bounds to ensure that the entire rectangle is displayed within the map bounds.
The following figure shows the resulting map view:
Spatial features based on arbitrary geographic points
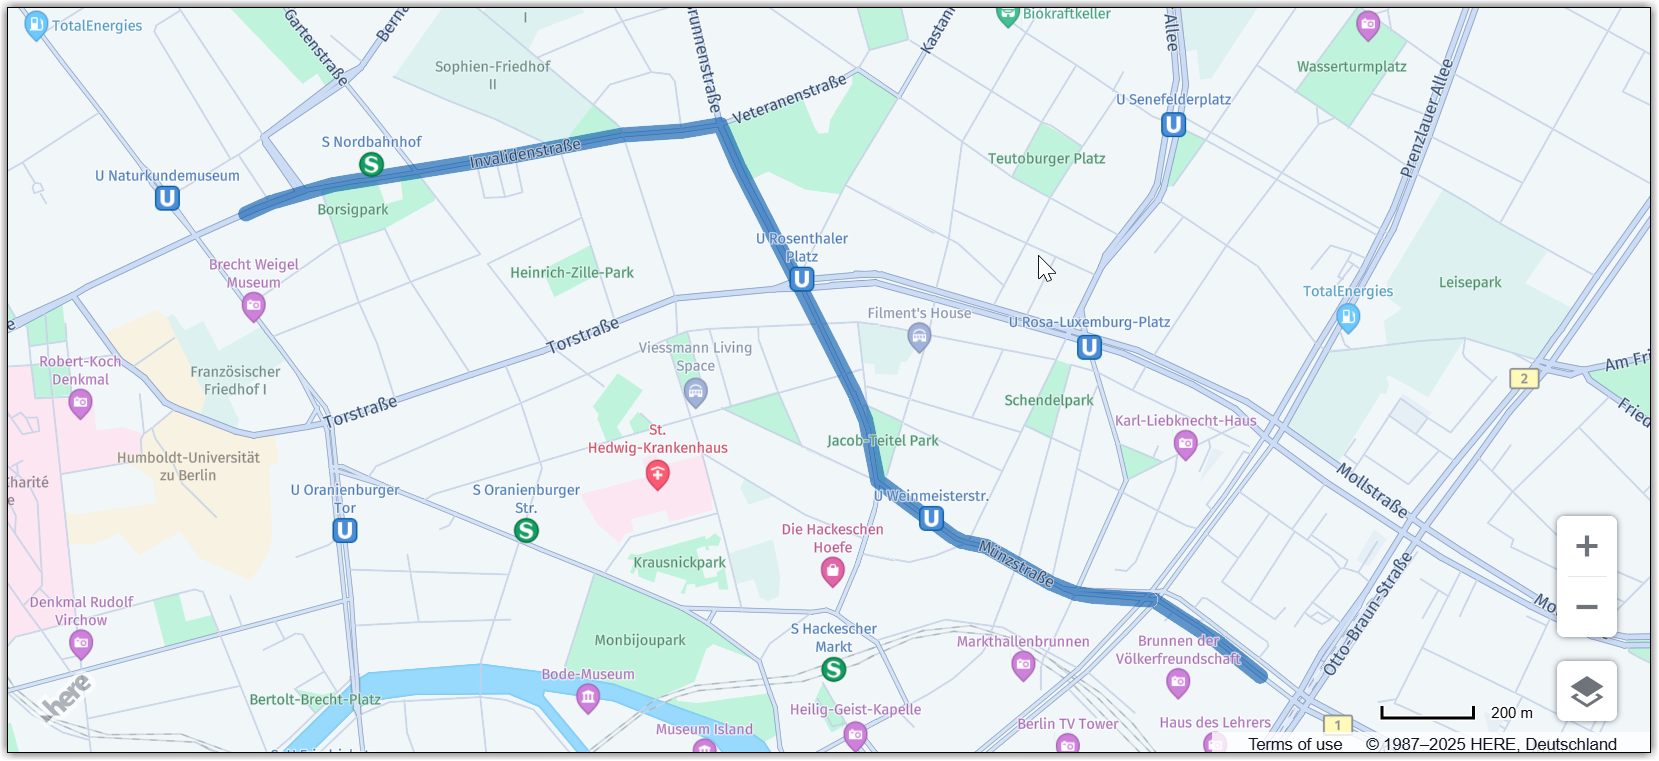
The previous examples demonstrate the use of pre-defined shapes to add a circle and a rectangle to a map, respectively. In most cases, however, map shapes are created from arbitrary sources such as GPS traces or routing information. The following example illustrates how to convert arbitrary geographical points into a polyline.
To achieve this, the code defines an array of points using their latitude and longitude coordinates and then converts these points to a LineString object (H.geo.LineString), which represents an ordered set of points. This LineString instance serves as a point source for the polyline.
Finally, the code adds the polyline to the map and sets the view bounds so that the entire shape is visible within the map bounds.
// Define points to represent the vertices of a short route in Berlin, Germany:
var points = [
  { lat: 52.5309825, lng: 13.3845921 },
  { lat: 52.5311923, lng: 13.3853495 },
  { lat: 52.5313532, lng: 13.3861756 },
  { lat: 52.5315142, lng: 13.3872163 },
  { lat: 52.5316215, lng: 13.3885574 },
  { lat: 52.5320399, lng: 13.3925807 },
  { lat: 52.5321472, lng: 13.3935785 },
  { lat: 52.5323832, lng: 13.395499  },
  { lat: 52.5324261, lng: 13.3959818 },
  { lat: 52.5325012, lng: 13.397795  },
  { lat: 52.5325656, lng: 13.3986318 },
  { lat: 52.5326192, lng: 13.3989215 },
  { lat: 52.5325119, lng: 13.3989751 },
  { lat: 52.5323081, lng: 13.3991039 },
  { lat: 52.5318789, lng: 13.3994472 },
  { lat: 52.5301194, lng: 13.4009278 },
  { lat: 52.5297546, lng: 13.4012604 },
  { lat: 52.5296152, lng: 13.4014106 },
  { lat: 52.5289822, lng: 13.4018934 },
  { lat: 52.5276947, lng: 13.4029663 },
  { lat: 52.5271797, lng: 13.4033203 },
  { lat: 52.5269973, lng: 13.4033954 },
  { lat: 52.5265145, lng: 13.4035349 },
  { lat: 52.5260746, lng: 13.4036851 },
  { lat: 52.5260103, lng: 13.4038353 },
  { lat: 52.5256562, lng: 13.40464   },
  { lat: 52.5253022, lng: 13.4053588 },
  { lat: 52.5250447, lng: 13.4059381 },
  { lat: 52.5249588, lng: 13.4062278 },
  { lat: 52.5249267, lng: 13.4064317 },
  { lat: 52.5249052, lng: 13.406775  },
  { lat: 52.5248623, lng: 13.4069574 },
  { lat: 52.5241864, lng: 13.4089208 },
  { lat: 52.5241327, lng: 13.4091246 },
  { lat: 52.5240898, lng: 13.409307  },
  { lat: 52.5240040, lng: 13.4096611 },
  { lat: 52.5239503, lng: 13.4101653 },
  { lat: 52.5239289, lng: 13.4110343 },
  { lat: 52.5238967, lng: 13.4117103 },
  { lat: 52.5238752, lng: 13.4120321 },
  { lat: 52.5236285, lng: 13.4126866 },
  { lat: 52.5231242, lng: 13.4139311 },
  { lat: 52.5227809, lng: 13.4146714 },
  { lat: 52.5224799, lng: 13.4152412 }
];

// Initialize a linestring and add all the points to it:
var linestring = new H.geo.LineString();
points.forEach(function(point) {
  linestring.pushPoint(point);
});

// Initialize a polyline with the linestring:
var polyline = new H.map.Polyline(linestring, { style: { lineWidth: 10 }});

// Add the polyline to the map:
map.addObject(polyline);

// Zoom the map to fit the rectangle:
map.getViewModel().setLookAtData({bounds: polyline.getBoundingBox()});
The following image shows a map with the polyline created by the code from the preceding example: