Display a heatmap at a specific location
Display a heatmap at a specific location
A heatmap in HERE Maps API for JavaScript is a visual representation of data where values are depicted by colors. Heatmaps are used to show the density or intensity of events or quantities in a given geographical area, allowing for the visualization of patterns or trends across the map. They are commonly used to overlay data on top of a map for analytical purposes, such as displaying areas of high traffic, population density, or any other metric that can be geographically represented.
This tutorial demonstrates how to use a simple heatmap in HERE Maps API for JavaScript in three steps:
- Create a base map
- Add default UI controls to the map
- Add a heatmap layer to the map
Before you begin
- Obtain an API Key: If you do not have one already, sign up for a HERE platform account and generate an API key. For more information, see Get started with HERE Maps API for JavaScript.
Create a base map
Create a HTML container and add JavaScript code for rendering the HERE map.
-
Create an empty HTML file.
-
In the
<head>element of the HTML file, include references to the libraries, as shown in the following example:<!DOCTYPE html> <html> <head> <link rel="stylesheet" type="text/css" href="https://js.api.here.com/v3/3.2/mapsjs-ui.css" /> <script type="text/javascript" src="https://js.api.here.com/v3/3.2/mapsjs-core.js" ></script> <script type="text/javascript" src="https://js.api.here.com/v3/3.2/mapsjs-service.js" ></script> <script type="text/javascript" src="https://js.api.here.com/v3/3.2/mapsjs-ui.js" ></script> <script type="text/javascript" src="https://js.api.here.com/v3/3.2/mapsjs-mapevents.js" ></script> <script type="text/javascript" src="https://js.api.here.com/v3/3.2/mapsjs-data.js" ></script> </head> <body></body> </html> -
Within the
<head>element, add a<style>element that sets the width, height, and position of thebodyandmapelements:<style> body { width: 100%; height: 100%; position: absolute; margin: 0px; padding: 0px; overflow: hidden; } #map { width: 100%; height: 100%; background: grey; } </style>Note
These style settings configure the map to occupy the full width and height of the browser window.
-
Within the
<body>element of the HTML file, include a<div>element with an id ofmap. This is where the map will be displayed. For example:<div id="map"></div> -
Within the
<body>element and inside a<script>tag, create a base map with default layers using the following code snippet:// Initiate and authenticate your connection to the HERE platform const platform = new H.service.Platform({ 'apikey': 'your API key' }); // Obtain the default map types from the platform object const defaultLayers = platform.createDefaultLayers(); // Instantiate (and display) a map: const map = new H.Map( document.getElementById("map"), // Center the map on Europe, with the zoom level of 5 defaultLayers.vector.normal.map, { zoom: 5, center: { lat: 50, lng: 12 } }); // MapEvents enables the event system // The behavior variable implements default interactions for pan/zoom (also on mobile touch environments) const behavior = new H.mapevents.Behavior(new H.mapevents.MapEvents(map)); // Enable dynamic resizing of the map, based on the current size of the enclosing container window.addEventListener('resize', () => map.getViewPort().resize()); -
Replace the value of the
apikeyvariable with your personal API key.
Add default UI controls to the map
The default UI controls in Maps API for JavaScript save development time, improve usability, and provide customization options, resulting in a more efficient and user-friendly mapping application. To use default UI controls, add the following code snippet to your JavaScript after the map instantiation:
// Create the default UI:
const ui = H.ui.UI.createDefault(map, defaultLayers);
For more information on UI controls, see Customize maps with map controls and UI.
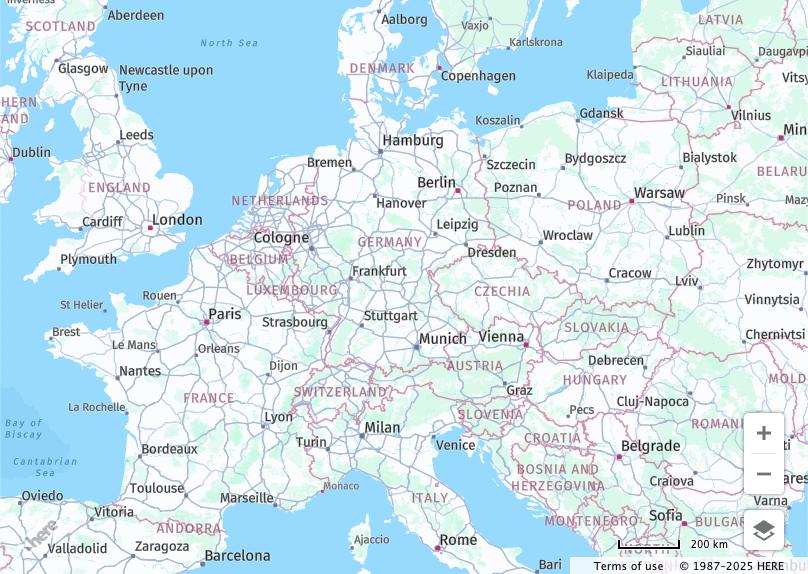
Result: The HTML file displays a basic map centered over Europe, as shown in the following example:
Add a heatmap layer to the map
To add a heatmap to the the map, you must code the following items:
- A provider from
H.data.heatmap.Providerclass - Heatmap data
- A map layer for the heatmap Provider
Append the following code snippet to your JavaScript to add these items:
// Create a provider for a semi-transparent heat map
const heatmapProvider = new H.data.heatmap.Provider({
  colors: new H.data.heatmap.Colors(
    {
      0: "blue",
      0.5: "red",
      1: "yellow",
    },
    true
  ),
  opacity: 0.9,
  // Paint assumed values in regions where no data is available
  assumeValues: false,
});

// Add the data:
heatmapProvider.addData([
  { lat: 59.911491, lng: 10.757933, value: 5 }, // Oslo
  { lat: 59.8909, lng: 10.5278, value: 1 }, // Sandvika
  { lat: 59.9245, lng: 10.954, value: 3 }, // Lorenskog
]);

// Add a layer for the heatmap provider to the map
map.addLayer(new H.map.layer.TileLayer(heatmapProvider));

// Move the map to Oslo, Norway
map.setCenter({ lat: 59.911491, lng: 10.757933 });
map.setZoom(11);
The H.data.heatmap.Colors class in HERE Maps API for JavaScript allows you to customize the colors of a heatmap. You define colors associated with normalized heat values (ranging from 0 to 1) using the stops property. This property maps these values to specific colors, which can be defined in CSS syntax. Optionally, you can enable color interpolation with the opt_interpolate boolean to create smooth transitions between colors. If opt_interpolate is set to false, the heatmap will have a posterized effect. Incorrect syntax or an empty stops object will throw an H.lang.InvalidArgumentError. For more information, see Colors class.
Note that the assumeValues property is a boolean option that, when set to true, allows the heatmap to paint assumed values in regions where no data is available. This is useful for value maps generated from small datasets, enabling the heatmap to fill tiles with no available data with an average value derived from the dataset. The default value for assumeValues is false.
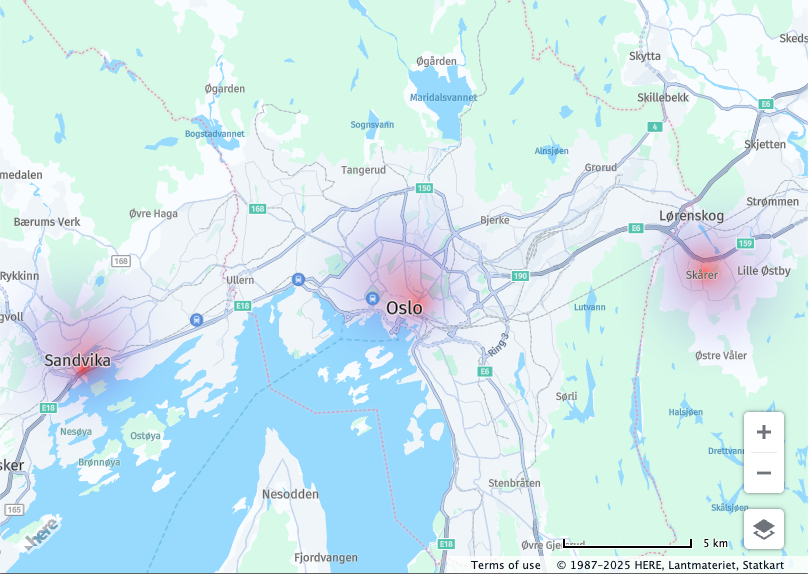
Result: The HTML file displays a heat map focused on three Norwegian cities, as shown in the following example:
Next steps
- For more information on heatmaps, see the API Reference.
- For more practical applications of the Maps API for JavaScript, see the
Tutorialssection of this guide.