Cluster data for visualization
When displaying large data sets with thousands of points on a map, you may encounter potential issues. For example, some performance degradation can occur if all markers are visible at lower zoom levels, resulting in slower rendering times. In other cases, markers in close geographic proximity might overlap and obscure each other at lower zoom levels, reducing the map's readability.
To address these challenges, consider using clustering. Clustering collapses two or more nearby points on the screen into a single cluster point, reducing visual clutter and preserving the visibility of noise points (individual data points that do not belong to any cluster) on the map.
This tutorial example uses sample data points that represent airports in London, UK, to walk you through the process of creating a cluster data set and then displaying it on a map.
Note
The following sections build upon the base map described in Get started with HERE Maps API for JavaScript as the foundation for introducing code additions.
Enable clustering
Import the necessary libraries and center the map at the cluster location. Ensure that the <head> element of you HTML file, includes the clustering module mapsjs-clustering.js, as shown in the following example:
<!DOCTYPE html>
<html>
  <head>
    <script type="text/javascript"
        src="https://js.api.here.com/v3/3.2/mapsjs-core.js"></script>
    <script type="text/javascript"
        src="https://js.api.here.com/v3/3.2/mapsjs-service.js"></script>
    <script type="text/javascript"
        src="https://js.api.here.com/v3/3.2/mapsjs-mapevents.js"></script>
    <script type="text/javascript" charset="utf-8"
        src="https://js.api.here.com/v3/3.2/mapsjs-clustering.js"></script>
    <script type="text/javascript" charset="utf-8"
        src="https://js.api.here.com/v3/3.2/mapsjs-ui.js" ></script>
  </head>
<!-- Other HTML elements omitted for brevity -->
</html>
Create a clustering data set
Within your JavaScript snippet, create a variable that stores data points to display as clusters on the map, as shown in the following example:
const data = [
  new H.clustering.DataPoint(51.4748, -0.368),  // City Airport (LCY)
  new H.clustering.DataPoint(51.8897, 0.2629),  // Biggin Hill Airport (BQH)
  new H.clustering.DataPoint(51.4508, -0.1546), // Heathrow Airport (LHR)
  new H.clustering.DataPoint(51.3483, -0.5037), // Gatwick Airport (LGW)
  new H.clustering.DataPoint(51.1537, -0.1821), // Luton Airport (LTN)
  new H.clustering.DataPoint(51.7588, -0.262),  // Stansted Airport (STN)
];
In this example, the data array is initialized with instances of H.clustering.DataPoint, each representing an airport location in London, UK. Each DataPoint object contains latitude and longitude values that describe the location's geographical coordinates.
Note
You can modify the data set by adding, removing, or replacing the datapoints. Calling these methods triggers re-clustering.
Display cluster data on the map
Initialize a HERE Maps clustering data provider and layer. Then, add the data points to the map as a clustered layer, as shown in the following example:
const clusteredDataProvider = new H.clustering.Provider(data);

// Create a layer that includes the data provider and its data points:
const layer = new H.map.layer.ObjectLayer(clusteredDataProvider);

// Add the layer to the map:
map.addLayer(layer);

// Calculate the bounding box of the data points
const bounds = new H.geo.MultiPoint(data).getBoundingBox();
// Automatically center and zoom the map to fit all data points
map.getViewModel().setLookAtData({
    bounds
});
This code creates an H.clustering.Provider object that runs the clustering algorithm and groups data points, depending on their screen density. The H.map.layer.ObjectLayer object adds the clustered data points on the map.
To ensure that all data points are fully visible when the map loads initially, consider adding padding to the map as illustrated by the following example:
const map = new H.Map(
  document.getElementById("mapContainer"),
  defaultLayers.vector.normal.map, {
      zoom: 10,
      // padding set to 25 pixels
      padding: {
          top: 50,
          left: 50,
          bottom: 50,
          right: 50
      },
      center: {
          lat: 52.5,
          lng: 13.4
      }
  });
The following figure shows how the HERE clustering algorithm renders the airport data set on the map as clusters or individual data points, depending on the zoom level:
Customize criteria for cluster creation
To customize the clustering algorithm for your use case, you can adjust the parameters of the H.clustering.Provider class.
This class includes properties that determine how clusters and noise points are visually represented, the maximum radius for data points to be considered part of a cluster, and the minimum weight required to form a cluster.
To adjust clustering behavior to your needs, update the H.clustering.Provider instance with your customizations. For example:
const clusteredDataProvider = new H.clustering.Provider(dataPoints, {
  min: 4,
  max: 10,
  clusteringOptions: {
    eps: 32,
    minWeight: 3
  }
});
where:
- The
minandmaxproperties are not part of the configurable options of theH.clustering.Providerclass. These options define the zoom level range in which clustering occurs. - The
epsproperty determines the maximum radius within which data points are considered as part of a cluster.
For example, in the code example, the eps value is set to 32. This means that if two data points are within 32 pixels of each other on the map, the clustering algorithm considers them as part of the same cluster.
- The
minWeightproperty determines the minimum weight required to form a cluster.
In the example provided, the minWeight property is set to 3, which means that three data points with a combined weight of at least 3 are required to form a cluster. For example, if there are three data points each with a weight of 1, or two data points with a weight of 2 and one data point with a weight of 1, they are clustered together. However, if there are only two data points each with a weight of 1, they are not clustered together.
You can assign a custom weight to a point when creating the corresponding
DataPoint, as shown in the following example:new H.clustering.DataPoint(lat, lng, weight)
Customize cluster visualization and style
On the map, clusters and noise points are represented using markers. By default, the clustering provider employs the standard bitmap markers theme, which incorporates weight information to display clusters and noise points on the map. To customize the appearance of markers to suit your specific use case, you can create a custom theme and set it as the value of the theme property when calling the provider.
The following steps provide a sample customized theme for markers:
-
Define an SVG template to use for noise icons. The following template consists of an SVG element with a green circle inside:
// SVG template to use for noise icons const noiseSvg = '<svg xmlns="http://www.w3.org/2000/svg" height="20px" width="20px"><circle cx="5px" cy="5px" r="5px" fill="green" /></svg>'; -
Create an
H.map.Iconobject by using thenoiseSvgtemplate. Specify the size and anchor of the icon in pixels:// Create an icon to represent the noise points // Note that same icon will be used for all noise points const noiseIcon = new H.map.Icon(noiseSvg, { size: { w: 20, h: 20 }, anchor: { x: 10, y: 10 }, }); -
Define an SVG template to use for cluster icons. The following template consists of an SVG element with a red circle inside, with the size and position of the circle specified using variables:
// SVG template to use for cluster icons const clusterSvgTemplate = '<svg xmlns="http://www.w3.org/2000/svg" height="{diameter}" width="{diameter}">' + '<circle cx="{radius}px" cy="{radius}px" r="{radius}px" fill="red" />' + "</svg>"; -
Modify the
H.clustering.Providerobject to take an array ofdataPointsand athemeimplementation as parameters:const clusteredDataProvider = new H.clustering.Provider(data, { theme: { getClusterPresentation: function(cluster) { const weight = cluster.getWeight(); const radius = weight * 5; const diameter = radius * 2; const svgString = clusterSvgTemplate .replace(/\{radius\}/g, radius) .replace(/\{diameter\}/g, diameter); const clusterIcon = new H.map.Icon(svgString, { size: { w: diameter, h: diameter }, anchor: { x: radius, y: radius } }); const clusterMarker = new H.map.Marker(cluster.getPosition(), { icon: clusterIcon, min: cluster.getMinZoom(), max: cluster.getMaxZoom() }); clusterMarker.setData(cluster); return clusterMarker; }, getNoisePresentation: function(noisePoint) { const noiseMarker = new H.map.Marker(noisePoint.getPosition(), { icon: noiseIcon, min: noisePoint.getMinZoom() }); noiseMarker.setData(noisePoint); return noiseMarker; } } });The
themeimplementation specifies how the clusters and noise points are displayed on the map, where:-
The
getClusterPresentation()function calculates the size and position of the cluster icon using the weight of the cluster and the SVG template that you defined earlier. The function then creates anH.map.Markerobject for the cluster by using the icon, minimum and maximum zoom levels, and data for the marker. -
The
getNoisePresentation()function creates anH.map.Markerobject for each noise point by using the same SVG template that you defined earlier and sets the icon and minimum zoom level for the marker.
The following figure shows the result of using a custom theme for clustering data points. In this figure, cluster markers are represented as red circles and noise points are represented as green circles.: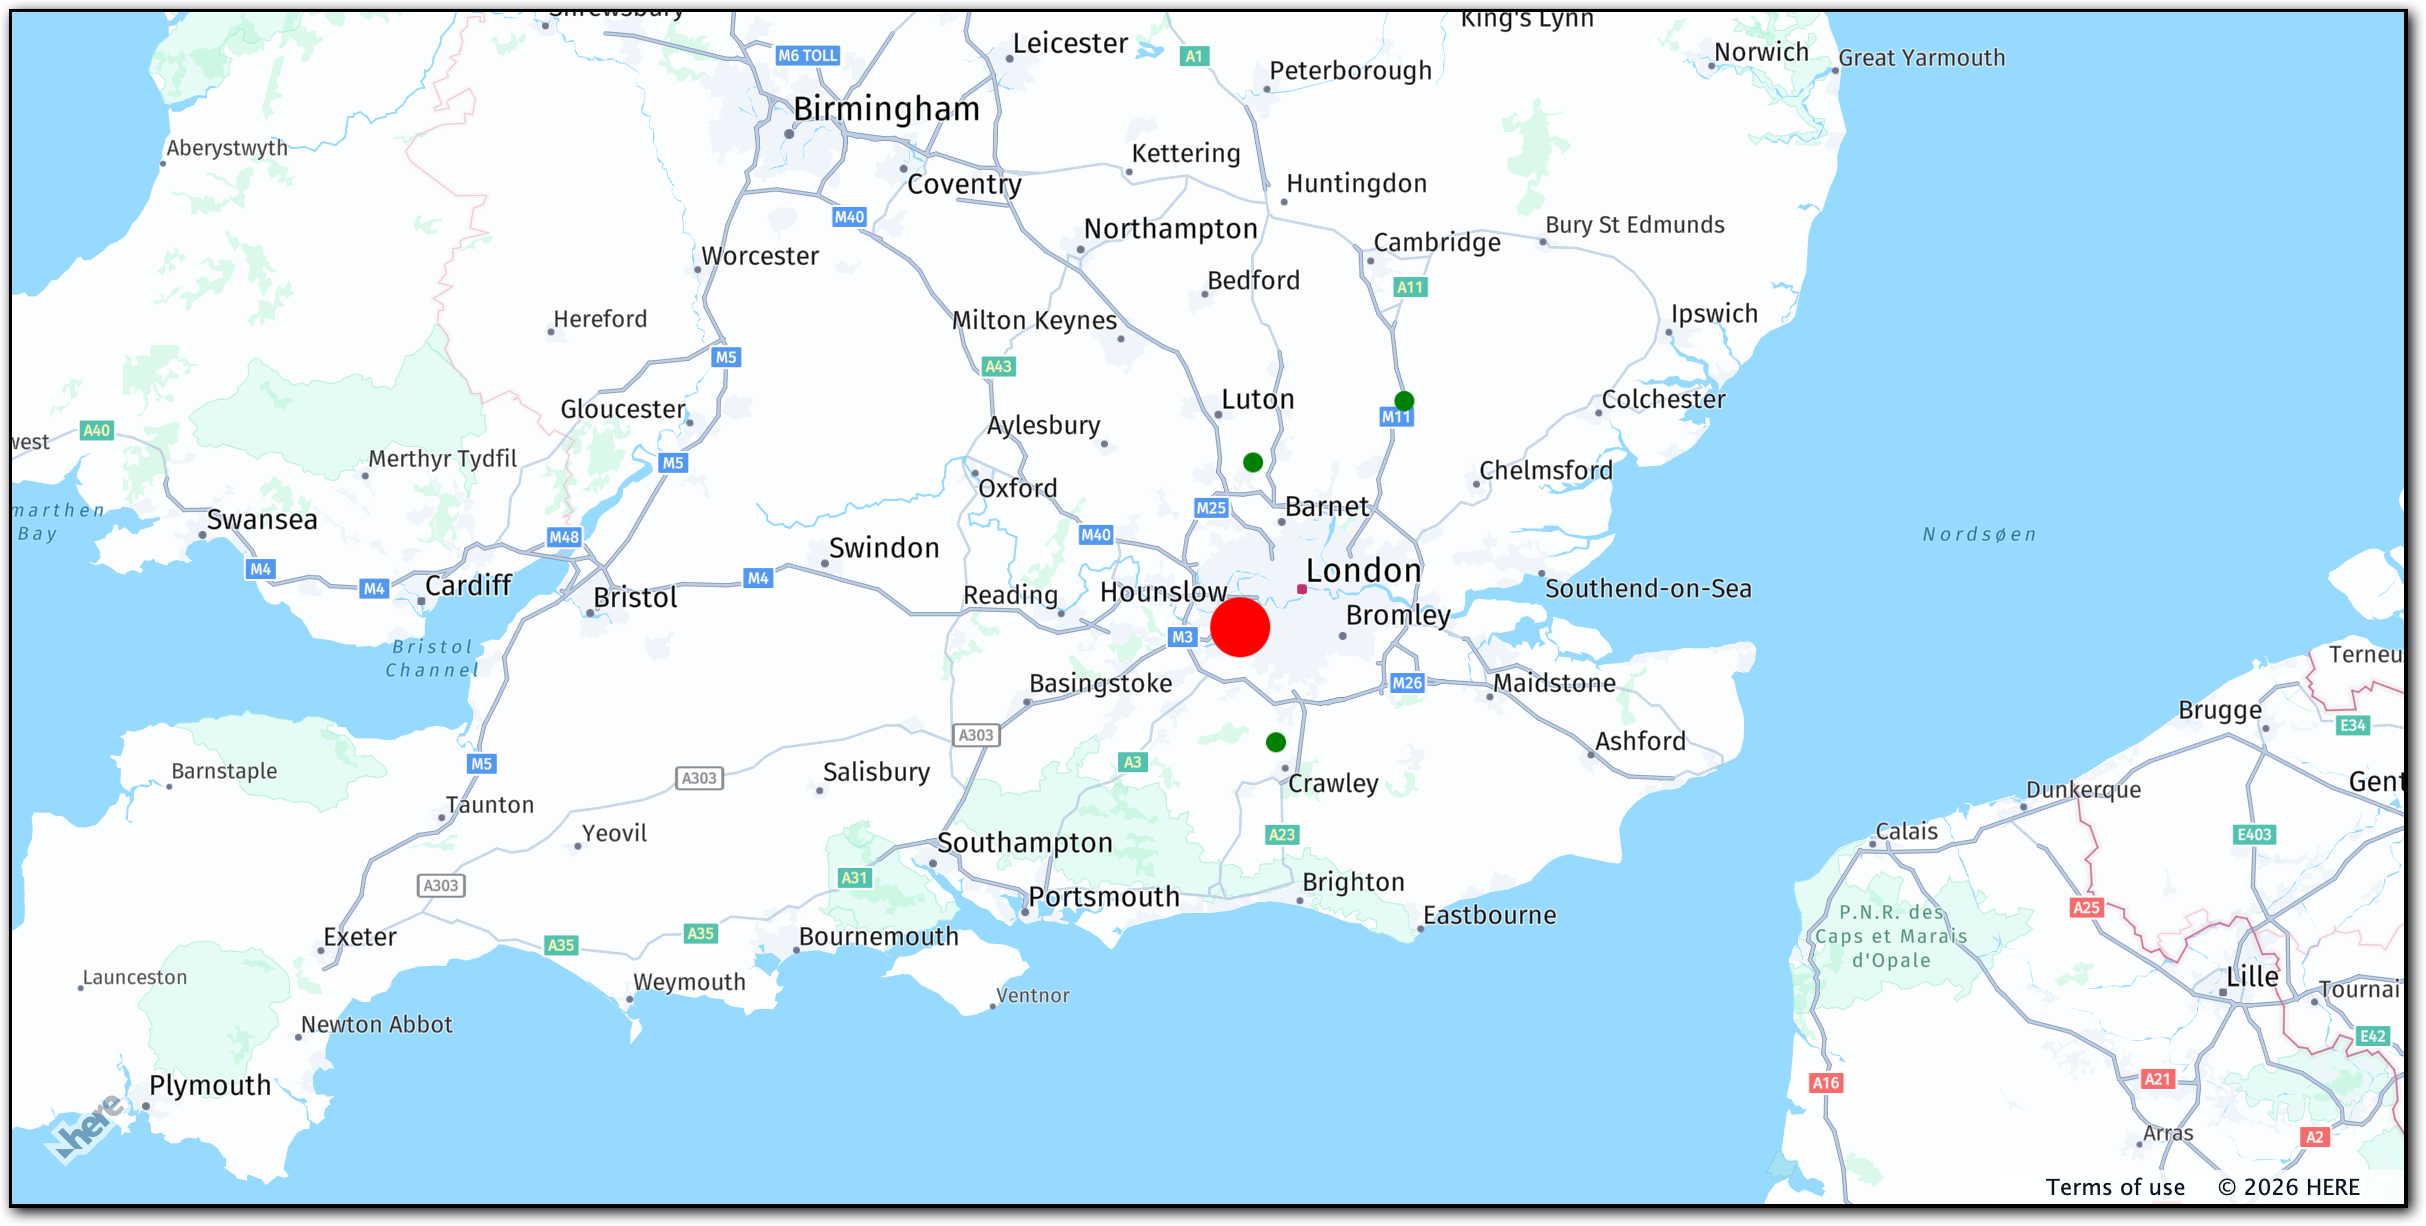
-
Interact with cluster and noise point markers
You can interact with markers representing clusters and noise points and access cluster H.clustering.ICluster or noise point H.clustering.INoisePoint data on demand by using map events.
For more information, see H.clustering.
To process a specific event type in the clustering provider, you can add an event listener for that type.
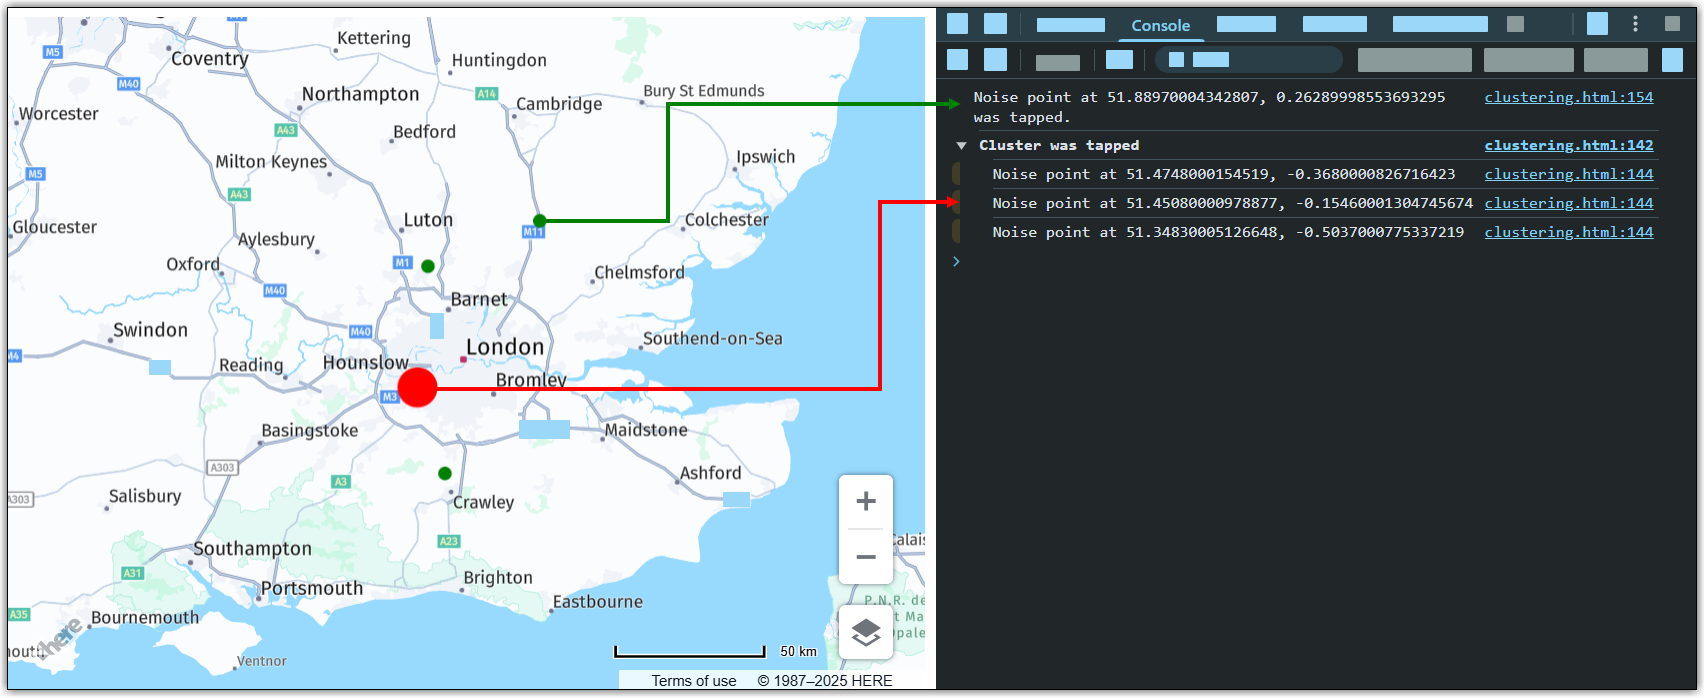
In the following example, an event listener is added to the clustered data provider to detect when a marker has been tapped. When a marker is tapped, the latitude and longitude of the marker are logged to the console, depending on the marker type.
// Add tap event listener to handle cluster and noise point interactions:
clusteredDataProvider.addEventListener("tap", function (event) {
const marker = event.target;
const point = marker.getData();
if (point.isCluster()) {
console.group("Cluster was tapped");
point.forEachDataPoint((dataPoint) => {
console.log(
"Noise point at " +
dataPoint.getPosition().lat +
", " +
dataPoint.getPosition().lng
);
});
console.groupEnd();
} else {
console.log(
"Noise point at " +
point.getPosition().lat +
", " +
point.getPosition().lng +
" was tapped."
);
}
}, false);The following figure shows the output in the developer console window:
Full source code
This section contains the full JavaScript code that was used in this tutorial. This code sets up a map and adds multiple markers to it, which are clustered together based on their proximity. The code also defines how the markers should look and behave when clicked, as well as adding an event listener to log the latitude and longitude of any clicked markers. Finally, the code enables default pan and zoom interactions on the map.
// Initiate and authenticate your connection to the HERE platform:
const platform = new H.service.Platform({
apikey: 'apikey'
});
// Obtain the default map types from the platform object:
const defaultLayers = platform.createDefaultLayers();
// Instantiate (and display) a map:
const map = new H.Map(
document.getElementById("mapContainer"),
defaultLayers.vector.normal.map, {
zoom: 10,
padding: {
top: 50,
left: 50,
bottom: 50,
right: 50
},
center: {
lat: 52.5,
lng: 13.4
}
}
);
// Define noise data points (e.g., airport locations):
const data = [
new H.clustering.DataPoint(51.4748, -0.368), // City Airport (LCY)
new H.clustering.DataPoint(51.8897, 0.2629), // Biggin Hill Airport (BQH)
new H.clustering.DataPoint(51.4508, -0.1546), // Heathrow Airport (LHR)
new H.clustering.DataPoint(51.3483, -0.5037), // Gatwick Airport (LGW)
new H.clustering.DataPoint(51.1537, -0.1821), // Luton Airport (LTN)
new H.clustering.DataPoint(51.7588, -0.262), // Stansted Airport (STN)
];
// SVG template for noise icons:
const noiseSvg =
'<svg xmlns="http://www.w3.org/2000/svg" height="20px" width="20px">' +
'<circle cx="10" cy="10" r="5" fill="green" />' +
'</svg>';
// Create a reusable icon for noise points:
const noiseIcon = new H.map.Icon(noiseSvg, {
size: {
w: 20,
h: 20
},
anchor: {
x: 10,
y: 10
}
});
// SVG template for cluster icons:
const clusterSvgTemplate =
'<svg xmlns="http://www.w3.org/2000/svg" height="{diameter}" width="{diameter}">' +
'<circle cx="{radius}" cy="{radius}" r="{radius}" fill="red" />' +
'</svg>';
// Create a clustered data provider with custom presentation logic:
const clusteredDataProvider = new H.clustering.Provider(data, {
  theme: {
    getClusterPresentation: function(cluster) {
      const weight = cluster.getWeight();
      const radius = weight * 5;
      const diameter = radius * 2;

      const svgString = clusterSvgTemplate
      .replace(/\{radius\}/g, radius)
      .replace(/\{diameter\}/g, diameter);

      const clusterIcon = new H.map.Icon(svgString, {
        size: {
          w: diameter,
          h: diameter
        },
        anchor: {
          x: radius,
          y: radius
        }
      });

      const clusterMarker = new H.map.Marker(cluster.getPosition(), {
        icon: clusterIcon,
        min: cluster.getMinZoom(),
        max: cluster.getMaxZoom()
      });

      clusterMarker.setData(cluster);
      return clusterMarker;
    },

    getNoisePresentation: function(noisePoint) {
      const noiseMarker = new H.map.Marker(noisePoint.getPosition(), {
        icon: noiseIcon,
        min: noisePoint.getMinZoom()
      });

      noiseMarker.setData(noisePoint);
      return noiseMarker;
    }
  }
});
// Add tap event listener to handle cluster and noise point interactions:
clusteredDataProvider.addEventListener("tap", function(event) {
const marker = event.target;
const point = marker.getData();
if (point.isCluster()) {
console.group("Cluster was tapped");
point.forEachDataPoint((dataPoint) => {
console.log(
"Noise point at " +
dataPoint.getPosition().lat +
", " +
dataPoint.getPosition().lng
);
});
console.groupEnd();
} else {
console.log(
"Noise point at " +
point.getPosition().lat +
", " +
point.getPosition().lng +
" was tapped."
);
}
}, false);
// Create and add the clustered layer to the map:
const layer = new H.map.layer.ObjectLayer(clusteredDataProvider);
map.addLayer(layer);
// Automatically center and zoom the map to fit all data points:
const bounds = new H.geo.MultiPoint(data).getBoundingBox();
map.getViewModel().setLookAtData({
bounds
});
// Enable default map interactions (pan/zoom):
const behavior = new H.mapevents.Behavior(new H.mapevents.MapEvents(map));
// Handle dynamic resizing of the map container:
window.addEventListener('resize', () => map.getViewPort().resize());
// Create default UI controls:
const ui = H.ui.UI.createDefault(map, defaultLayers);Next steps
For more information on the HERE Maps API for JavaScript design and functionality, see API Reference.