

カスタムレイヤーを追加する
HERE SDKには、HERE Style EditorおよびStyleクラスを使用して地図をカスタマイズするためのさまざまなオプションが用意されています。その他のオプションについては、以下で説明します。
- **カスタムラスターレイヤー:**ラスターデータソースを使用して、マップスキーム上にタイル画像をオーバーレイします。
- **ポイント、ライン、ポリゴンのカスタムレイヤー:**ポイント、タイル、ポリゴンレイヤーを使用して、カスタマイズ可能なコンテンツを地図に追加します。
- **ポイント、タイル、ポリゴンのカスタムレイヤーのタイルデータソース:**ポイント、タイル、ポリゴンのソースを提供することで、大規模なデータセットを効率的に管理および表示できます。
カスタムラスターレイヤーを追加する
カスタムラスターレイヤーを使用すると、HERE MapSchemeスタイルの上に独自のラスタータイルサービスを追加できます。これは、世界から選択したエリアにオーバーレイとして表示するタイルをホストする独自のサーバー、またはOpenStreetMapなどの公開タイルサーバーを使用できます。完全に不透明なマップ タイル オーバーレイおよび完全に透明なマップ タイル オーバーレイがサポートされています。また、複数のラスター レイヤーを地図に同時に追加できます。
注これはこの機能のベータリリースであるため、いくつかのバグや予期しない動作が発生する可能性があります。関連するAPIは、廃止のプロセスを経ずに、新しいリリースに変更される可能性があります。
カスタム ラスター レイヤーを追加するには、RasterDataSource を作成する必要があります。RasterDataSource は、表示するラスター タイル データのソースを表します。その設定を変更することもできます。RasterDataSourceConfiguration を使用すると、URL、タイル処理スキーマ、ストレージ レベル、キャッシュ パラメーターなどのデータ ソースの設定を指定できます。
最後に、MapLayerBuilder を使用して MapLayer を作成し、レンダリング可能なマップ オーバーレイを地図に追加できます。
MapLayerVisibilityRangeを使用して、マップレイヤーのズームレベルを指定します。MapLayerPriorityを使用して、MapLayerの描画順序を指定します。MapContentTypeを使用して、MapLayerによって表示されるデータ型を指定します。- 必要に応じて、
StyleAPI を使用して、実行時の不透明度や明るさなどのプロパティを調整します。詳細については、カスタム レイヤーのスタイル ガイドを参照してください。
ラスター タイル イメージの場合は、MapContentType.RASTER_IMAGE を使用します。
ピンチ、回転、ズームなど、地図のデフォルトのジェスチャー アクションは HERE ベクター マップの場合と同様にラスター タイルでも動作しますが、いくつかの違いがあります。たとえば、ラスター タイルはビットマップとして読み込まれるため、ラスター マップ タイルを回転させると、タイルに含まれているラベルと道路名もすべて回転します。
注カスタム マップ スタイルまたはデフォルトのマップ スタイルを使用してマップ シーンを読み込む場合、地図はベクター タイルを使用してレンダリングされます。ベクター タイルでは、マップ情報が頂点とパスで構成されるベクター データとして表されるため、スケーラビリティとパフォーマンスが向上します。これとは対照的に、ラスター タイルは等間隔に配置された正方形であり、ピクセル情報のみを表すビットマップ画像で構成されます。なお、衛星マップ スタイルもラスターをベースとしています。
次のようにRasterDataSourceを作成します。
private RasterDataSource createRasterDataSource(String dataSourceName) {
    // Note: As an example, below is an URL template of an outdoor layer from thunderforest.com.
    // On their web page you can register a key. Without setting a valid API key, the tiles will
    // show a watermark.
    // More details on the terms of usage can be found here: https://www.thunderforest.com/terms/
    // For example, your application must have working links to https://www.thunderforest.com
    // and https://www.osm.org/copyright.
    // For the below template URL, please pay attention to the following attribution:
    // Maps © www.thunderforest.com, Data © www.osm.org/copyright.
    // Alternatively, choose another tile provider or use the (customizable) map styles provided by HERE.
    String templateUrl = "https://tile.thunderforest.com/outdoors/{z}/{x}/{y}.png";

    // The storage levels available for this data source. Supported range [0, 31].
    List<Integer> storageLevels = Arrays.asList(2, 3, 4, 5, 6, 7, 8, 9, 10, 11, 12, 13, 14, 15, 16);
    RasterDataSourceConfiguration.Provider rasterProviderConfig = new RasterDataSourceConfiguration.Provider(
            TileUrlProviderFactory.fromXyzUrlTemplate(templateUrl),
            TilingScheme.QUAD_TREE_MERCATOR,
            storageLevels);

    // Raster tiles are stored in a separate cache on the device.
    String path = "cache/raster/mycustomlayer";
    long maxDiskSizeInBytes = 1024 * 1024 * 128; // 128 MB
    RasterDataSourceConfiguration.Cache cacheConfig = new RasterDataSourceConfiguration.Cache(path, maxDiskSizeInBytes);

    // Note that this will make the raster source already known to the passed map view.
    return RasterDataSource(mapView.getMapContext(),
            new RasterDataSourceConfiguration(dataSourceName, rasterProviderConfig, cacheConfig));
}
private fun createRasterDataSource(dataSourceName: String): RasterDataSource {
// Note: As an example, below is an URL template of an outdoor layer from thunderforest.com.
// On their web page you can register a key. Without setting a valid API key, the tiles will
// show a watermark.
// More details on the terms of usage can be found here: https://www.thunderforest.com/terms/
// For example, your application must have working links to https://www.thunderforest.com
// and https://www.osm.org/copyright.
// For the below template URL, please pay attention to the following attribution:
// Maps © www.thunderforest.com, Data © www.osm.org/copyright.
// Alternatively, choose another tile provider or use the (customizable) map styles provided by HERE.
val templateUrl = "https://tile.thunderforest.com/outdoors/{z}/{x}/{y}.png"
// The storage levels available for this data source. Supported range [0, 31].
val storageLevels: List<Int> =
mutableListOf(2, 3, 4, 5, 6, 7, 8, 9, 10, 11, 12, 13, 14, 15, 16)
val rasterProviderConfig = RasterDataSourceConfiguration.Provider(
TileUrlProviderFactory.fromXyzUrlTemplate(templateUrl)!!,
TilingScheme.QUAD_TREE_MERCATOR,
storageLevels
)
// If you want to add transparent layers then set this to true.
rasterProviderConfig.hasAlphaChannel = false
// Raster tiles are stored in a separate cache on the device.
val path = "cache/raster/mycustomlayer"
val maxDiskSizeInBytes = (1024 * 1024 * 128).toLong() // 128 MB.
val cacheConfig = RasterDataSourceConfiguration.Cache(path, maxDiskSizeInBytes)
// Note that this will make the raster source already known to the passed map view.
return RasterDataSource(
mapView.mapContext,
RasterDataSourceConfiguration(dataSourceName, rasterProviderConfig, cacheConfig)
)
}なお、必要に応じて次のような templateUrl の呼び出しに含めることもできます。
RasterDataSourceConfiguration.Provider rasterProviderConfig = new RasterDataSourceConfiguration.Provider(
        TilingScheme.QUAD_TREE_MERCATOR,
        storageLevels,
        new TileUrlProviderCallback() {
    @NonNull
    @Override
    public String onTileUrlRequest(int x, int y, int level) {
        return "https://tile.thunderforest.com/outdoors/" + level + "/" + x + "/" + y +".png";
    }
});
後者では、各タイル リクエストをリッスンするオプションが提供され、たとえば、必要に応じて、リクエストされたタイルをより詳細に制御できます。
なお、カスタム ラスター レイヤーは独自のキャッシュ ディレクトリを使用します。これにより、ベクター ベースのマップ データに使われるマップ キャッシュから独立できます。詳細については、「APIリファレンス」でRasterDataSourceConfigurationを参照してください。
このコードは、Thunderforest のタイル ソースを使用します。利用規約の詳細については、https://www.thunderforest.com/terms/ および https://www.osm.org/copyright を参照してください。
なお、OSM 標準スタイル形式の /zoom/x/y.png に従う他のタイル ソースも使用できます。templateURL は次のようになります。
https://YourRasterTileService.com/{zoom}/{xTile}/{yTile}.png
zoom 値は地図の現在のズーム レベルを表し、xTile と yTile は水平のタイル番号と垂直のタイル番号を定義します。たとえば、標準の OSM 地図を表示するには、次のテンプレート URL を使用します。
let templateUrl = "https://a.tile.openstreetmap.org/{z}/{x}/{y}.png"
OSM 形式に従うその他のタイル サーバーはこちらにまとめてあります。なお、HERE SDK がサポートしているのはタイル サーバーのみです。ベクター データを提供するサーバーはサポートされていません。ベクター ベースのタイルは、HERE Style Editor および埋め込みマップ スタイル (上を参照) でのみ使用できます。
タイル ソースが作成されると、MapLayer を構築できます。
private MapLayer createMapLayer(String dataSourceName) {
    // The layer should be rendered on top of other layers including the "labels" layer
    // so that we don't overlap the raster layer over POI markers.
    MapLayerPriority priority = new MapLayerPriorityBuilder().renderedAfterLayer("labels").build();

    // And it should be visible for all zoom levels. The minimum tilt level is 0 and maximum zoom level is 23.
    MapLayerVisibilityRange range = new MapLayerVisibilityRange(MapCameraLimits.MIN_TILT, MapCameraLimits.MAX_ZOOM_LEVEL);

    try {
        // Build and add the layer to the map.
        MapLayer mapLayer = new MapLayerBuilder()
                .forMap(mapView.getHereMap()) // mandatory parameter
                .withName(dataSourceName + "Layer") // mandatory parameter
                .withDataSource(dataSourceName, MapContentType.RASTER_IMAGE)
                .withPriority(priority)
                .withVisibilityRange(range)
                .build();
        return mapLayer;
    } catch (MapLayerBuilder.InstantiationException e) {
        throw new RuntimeException(e.getMessage());
    }
}
private fun createMapLayer(dataSourceName: String): MapLayer {
// The layer should be rendered on top of other layers including the "labels" layer
// so that we don't overlap the raster layer over POI markers.
val priority = MapLayerPriorityBuilder().renderedAfterLayer("labels").build()
// And it should be visible for all zoom levels. The minimum tilt level is 0 and maximum zoom level is 23.
val range =
MapLayerVisibilityRange(MapCameraLimits.MIN_TILT, MapCameraLimits.MAX_ZOOM_LEVEL)
try {
// Build and add the layer to the map.
val mapLayer = MapLayerBuilder()
.forMap(mapView.hereMap) // mandatory parameter
.withName(dataSourceName + "Layer") // mandatory parameter
.withDataSource(dataSourceName, MapContentType.RASTER_IMAGE)
.withPriority(priority)
.withVisibilityRange(range)
.build()
return mapLayer
} catch (e: MapLayerBuilder.InstantiationException) {
throw RuntimeException(e.message)
}
}上の例では「ラベル」レイヤーを参照しています。既存のレイヤーとその名前の詳細については、「API リファレンス」で MapLayerPriorityBuilder を参照してください。
最後に、可視性はレイヤーを有効または無効にすることで制御できます。一意の名前も指定する必要があります。各 RasterDataSource は 1 回のみ作成できます。
String dataSourceName = "myRasterDataSourceOutdoorStyle";
rasterDataSourceOutdoorStyle = createRasterDataSource(dataSourceName);
rasterMapLayerOutdoorStyle = createMapLayer(dataSourceName);

rasterMapLayerOutdoorStyle.setEnabled(true);
結果のレイヤーは次のようになります。
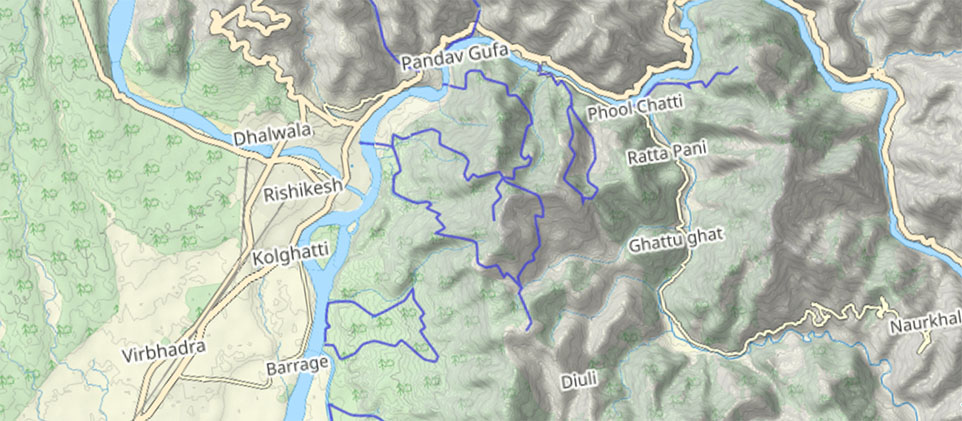
Screenshot: An outdoor map layer from Thunderforest.com shown on top of a map view
上のスクリーンショットは、カスタム ラスター タイルを他の HERE SDK 機能と簡単に組み合わせることができることを示しています。たとえば、タイル サーバーのタイル データの上に複数の MapMarker インスタンスをレンダリングできます。
注カスタム ラスター レイヤーの主な利点の 1 つは、透明なカスタム タイル ソースを上に配置して HERE マップ スタイルを簡単に拡張できることです。たとえば、天気予報データやその他の必要なデータを地図の上に表示できます。不透明なラスター タイル ソースを使用する場合は、空のベース マップ スタイルと組み合わせることをお勧めします。
空のベース マップ スタイルを使用しない場合、ラスター レイヤー タイルが読み込まれるまで、下層のマップ スキームが「透けて見える」状態となります。付属のサンプル アプリには、これがどのように見えるかが示されています。
他にも調整できるパラメーターがいくつかあります。
- たとえば、アプリで複数のラスター レイヤーを使用する場合、
MapLayerBuilderでレイヤーを作成するときに読み込みの優先順位を定義できます。これには整数値を指定できます。値が大きいレイヤーは、値が小さいレイヤーより前に読み込まれます。これはレイヤーが読み込まれる順番のみを制御します。 - レイヤーのレンダリング方法を制御するのは
MapLayerPriorityです。たとえば、任意でrenderedLast()を追加できます。これによりレイヤーは他の全レイヤーの上にレンダリングされます。 - 透明なマップ スタイルを表示するには、
rasterProviderConfig.hasAlphaChannelを true に設定します。 - その他のパラメーターについては、「APIリファレンス」を参照してください。
地図をパンしている間の読み込み時間を短縮するもう1つのオプションは、機能設定を調整することです (Navigateでのみ使用可能)。
カスタムレイヤーを追加してライン、ポリゴン、ポイントを保持する
地図の外観をカスタマイズするもう1つの方法は、Styleクラスを使用して、独自のライン、ポリゴンおよびポイントカスタムレイヤーを追加することです。これにより、実行時に外観をより柔軟に更新できるようになります。ほとんどのユースケースでは、MapMarker、MapPolyline、MapPolygonを代わりに使用することを検討してください。「マップアイテム」セクションを参照してください。大量のカスタムデータを扱う場合は、パフォーマンスとスケーラビリティを確保するために、代わりにライン、ポリゴン、ポイントのタイルソースを使用することを検討してください。
カスタムラインレイヤーを追加する
カスタム測地線を地図の外観に追加するには、HERE MapSchemeスタイルの上に独自のカスタムデータレイヤーを追加します。
測地線は地球の表面にある任意の2つのポイントを結ぶ最短線です。各ポイントは測地座標によって表されます。
注これはこの機能のベータリリースであるため、いくつかのバグや予期しない動作が発生する可能性があります。関連するAPIは、廃止のプロセスを経ずに、新しいリリースに変更される可能性があります。
カスタム ラスター レイヤーを追加するには、LineDataSource を作成する必要があります。LineDataSource は表示する測地線データのソースを表します。
各測地線はカスタム データ属性のセットと関連付けし、地図の上に表示する際にそれを使用して各線の外観をカスタマイズできます。
LineDataSource に加えて、MapLayerBuilder を使用して MapLayer を作成し、レンダリング可能なマップ オーバーレイを地図に追加できます。
MapLayerVisibilityRangeを使用して、マップレイヤーのズームレベルを指定します。MapLayerPriorityを使用して、MapLayerの描画順序を指定します。MapContentTypeを使用して、MapLayerによって表示されるデータ型を指定します。測地線の場合は、MapContentType.LINEを使用します。StyleAPI を使用して、実行時に幅や色などのプロパティを調整します。詳細については、カスタム レイヤーのスタイル ガイドを参照してください。
次のようにLineDataSourceを作成します。
private final static String MY_CUSTOM_LINES_DATA_SOURCE_NAME = "MyCustomLines";

private LineDataSource createLineDataSource(String dataSourceName) {
    // Creates a new LineDataSource, without custom data.
    // To also add custom lines while creating the data source, `LineDataSourceBuilder.withPolyline` API can be used.
    return new LineDataSourceBuilder(mapView.getMapContext()).withName(dataSourceName).build();
}
ライン データ ソースを作成したら、カスタム測地線を追加できます。
private void addLinesToDataSource(LineDataSource linesDataSource) {
    // Prepare the geodetic list of points that make-up the line.
    ArrayList<GeoCoordinates> lineGeoPoints = new ArrayList<GeoCoordinates>();
    lineGeoPoints.add(new GeoCoordinates(point1GeoLatitude, point1GeoLongitude));
    ...
    lineGeoPoints.add(new GeoCoordinates(pointNGeoLatitude, pointNGeoLongitude));

    // Optional: Prepare a list of custom attributes.
    DataAttributes lineAttributes = new DataAttributesBuilder().with("id", "my first line").build();

    // Add the line to data source.
    linesDataSource.add(new LineDataBuilder().withGeometry(new GeoPolyline(lineGeoPoints))
                                             .withAttributes(lineAttributes)
                                             .build());

    // Repeat above steps to add more custom lines to the data source.
    // Alternatively, use `LineDataSource.add` to add multiple custom lines with a single call.
    ...
}
ライン レイヤーのカスタム スタイルを準備します。
注以降の手順では、スタイル文字列の
layer値はMapLayerに付けた名前と一致している必要があります。この例で使われているdataSourceNameはMyCustomLinesで、レイヤー名はMyCustomLinesLayerです。
private final static String MY_CUSTOM_LAYER_STYLE =
    "{\n"
    + "  \"styles\": [\n"
    + "    {\n"
    + "      \"layer\": \"MyCustomLinesLayer\",\n"
    + "      \"technique\": \"line\",\n"
    + "      \"attr\": {\n"
    + "        \"width\": 5.0\n",
    + "        \"color\": \"#ff0000ff\"\n"
    + "      }\n"
    + "    }\n"
    + "  ]\n"
    + "}";

private Style createCustomStyle() {
    try {
        return JsonStyleFactory.createFromString(MY_CUSTOM_LAYER_STYLE);
    } catch (JsonStyleFactory.InstantiationException) {
        // Custom exception handling.
        ...
    }

    return null;
}
地図上に LineDataSource を表示するには、MapLayer を次のように構築します。
private MapLayer createMapLayer(String dataSourceName, Style layerStyle) {
    // Set the layer to be rendered on top of other layers.
    MapLayerPriority priority = new MapLayerPriorityBuilder().renderedLast().build();
    // And it should be visible for all zoom levels. The minimum tilt level is 0 and maximum zoom level is 23.
    MapLayerVisibilityRange range = new MapLayerVisibilityRange(MapCameraLimits.MIN_TILT, MapCameraLimits.MAX_ZOOM_LEVEL);

    try {
        // Build and add the layer to the map.
        MapLayer mapLayer = new MapLayerBuilder()
                .forMap(mapView.getHereMap()) // mandatory parameter
                .withName(dataSourceName + "Layer") // mandatory parameter
                .withDataSource(dataSourceName, MapContentType.LINE)
                .withPriority(priority)
                .withVisibilityRange(range)
                .withStyle(layerStyle)
                .build();
        return mapLayer;
    } catch (MapLayerBuilder.InstantiationException e) {
        throw new RuntimeException(e.getMessage());
    }
}
カスタムポリゴンレイヤーを追加する
カスタム測地ポリゴンを地図の外観に追加するには、HERE MapSchemeスタイルの上に独自のカスタムデータレイヤーを追加します。
測地ポリゴンは外部測地境界線と、1つ以上の内部境界線 (任意) によって定義されます。各境界線は測地ポイントを結んだループで構成され、最初のポイントは最後のポイントと同じとなります。
注これはこの機能のベータリリースであるため、いくつかのバグや予期しない動作が発生する可能性があります。関連するAPIは、廃止のプロセスを経ずに、新しいリリースに変更される可能性があります。
カスタム ポリゴン レイヤーを追加するには、PolygonDataSource を作成する必要があります。PolygonDataSource は表示する測地ポリゴン データのソースを表します。
各測地ポリゴンはカスタムデータ属性のセットと関連付けし、地図の上に表示する際にそれを使用して各ポリゴンの外観をカスタマイズできます。
PolygonDataSource に加えて、MapLayerBuilder を使用して MapLayer を作成し、レンダリング可能なマップ オーバーレイを地図に追加できます。
MapLayerVisibilityRangeを使用して、マップレイヤーのズームレベルを指定します。MapLayerPriorityを使用して、MapLayerの描画順序を指定します。MapContentTypeを使用して、MapLayerによって表示されるデータ型を指定します。測地ポリゴンの場合は、MapContentType.POLYGONを使用します。StyleAPI を使用して、実行時に色などのプロパティを調整します。詳細については、カスタム レイヤーのスタイル ガイドを参照してください。
次のようにPolygonDataSourceを作成します。
private final static String MY_CUSTOM_POLYGONS_DATA_SOURCE_NAME = "MyCustomPolygons";

private PolygonDataSource createPolygonDataSource(String dataSourceName) {
    // Creates a new PolygonDataSource, without custom data.
    // To also add custom polygons while creating the data source, `PolygonDataSourceBuilder.withPolygon` API can be used.
    return new PolygonDataSourceBuilder(mapView.getMapContext()).withName(dataSourceName).build();
}
ポリゴン データ ソースを作成したら、カスタム測地ポリゴンを追加できます。
private void addPolygonsToDataSource(PolygonDataSource polygonsDataSource) {
    // Prepare the geodetic list of points that make-up the polygon.
    // The point list must be closed and given in clockwise order.
    ArrayList<GeoCoordinates> polygonGeoPoints = new ArrayList<GeoCoordinates>();
    polygonGeoPoints.add(new GeoCoordinates(point1GeoLatitude, point1GeoLongitude));
    ...
    polygonGeoPoints.add(new GeoCoordinates(pointNGeoLatitude, pointNGeoLongitude));
    ...
    polygonGeoPoints.add(new GeoCoordinates(point1GeoLatitude, point1GeoLongitude));

    // Optional: Prepare a list of custom attributes.
    DataAttributes polygonAttributes = new DataAttributesBuilder().with("id", "my first polygon").build();

    // Add the polygon to data source.
    polygonsDataSource.add(new PolygonDataBuilder().withGeometry(new GeoPolygon(polygonGeoPoints))
                                                   .withAttributes(polygonAttributes)
                                                   .build());

    // Repeat above steps to add more custom polygons to the data source.
    // Alternatively, use `PolygonDataSource.add` to add multiple custom polygons with a single call.
    ...
}
ポリゴン レイヤーのカスタム スタイルを準備します。
注以降の手順では、スタイル文字列の
layer値はMapLayerに付けた名前と一致している必要があります。この例で使われているdataSourceNameはMyCustomPolygonsで、レイヤー名はMyCustomPolygonsLayerです。
private final static String MY_CUSTOM_LAYER_STYLE =
    "{\n"
    + "  \"styles\": [\n"
    + "    {\n"
    + "      \"layer\": \"MyCustomPolygonsLayer\",\n"
    + "      \"technique\": \"polygon\",\n"
    + "      \"attr\": {\n"
    + "        \"color\": \"#ff0000ff\"\n"
    + "      }\n"
    + "    }\n"
    + "  ]\n"
    + "}";

private Style createCustomStyle() {
    try {
        return JsonStyleFactory.createFromString(MY_CUSTOM_LAYER_STYLE);
    } catch (JsonStyleFactory.InstantiationException) {
        // Custom exception handling.
        ...
    }

    return null;
}
地図上に PolygonDataSource を表示するには、MapLayer を次のように構築します。
private MapLayer createMapLayer(String dataSourceName, Style layerStyle) {
    // Set the layer to be rendered on top of other layers.
    MapLayerPriority priority = new MapLayerPriorityBuilder().renderedLast().build();
    // And it should be visible for all zoom levels. The minimum tilt level is 0 and maximum zoom level is 23.
    MapLayerVisibilityRange range = new MapLayerVisibilityRange(MapCameraLimits.MIN_TILT, MapCameraLimits.MAX_ZOOM_LEVEL);

    try {
        // Build and add the layer to the map.
        MapLayer mapLayer = new MapLayerBuilder()
                .forMap(mapView.getHereMap()) // mandatory parameter
                .withName(dataSourceName + "Layer") // mandatory parameter
                .withDataSource(dataSourceName, MapContentType.POLYGON)
                .withPriority(priority)
                .withVisibilityRange(range)
                .withStyle(layerStyle)
                .build();
        return mapLayer;
    } catch (MapLayerBuilder.InstantiationException e) {
        throw new RuntimeException(e.getMessage());
    }
}
カスタムポイントレイヤーを追加する
カスタム測地ポイントを地図の外観に追加するには、HERE MapSchemeスタイルの上に独自のカスタムデータレイヤーを追加します。
注これはこの機能のベータリリースであるため、いくつかのバグや予期しない動作が発生する可能性があります。関連するAPIは、廃止のプロセスを経ずに、新しいリリースに変更される可能性があります。
カスタム ラスター レイヤーを追加するには、PointDataSource を作成する必要があります。PointDataSource は表示する測地ポイント データのソースを表します。
各測地ポイントはカスタム データ属性のセットと関連付けし、地図の上に表示する際にそれを使用して各ポイントの外観をカスタマイズできます。
PointDataSource に加えて、MapLayerBuilder を使用して MapLayer を作成し、レンダリング可能なマップ オーバーレイを地図に追加できます。
MapLayerVisibilityRangeを使用して、マップレイヤーのズームレベルを指定します。MapLayerPriorityを使用して、MapLayerの描画順序を指定します。MapContentTypeを使用して、MapLayerによって表示されるデータ型を指定します。測地ポイントの場合は、MapContentType.POINTを使用します。StyleAPIを使用して、実行時にアイコンなどのプロパティを調整します。詳細については、カスタム レイヤーのスタイル ガイドを参照してください。
次のようにPointDataSourceを作成します。
private final static String MY_CUSTOM_POINTS_DATA_SOURCE_NAME = "MyCustomPoints";

private PointDataSource createPointDataSource(String dataSourceName) {
    // Creates a new PointDataSource, without custom data.
    // To also add custom points while creating the data source, `PointDataSourceBuilder.withPoint` API can be used.
    return new PointDataSourceBuilder(mapView.getMapContext()).withName(dataSourceName).build();
}
ポイント データ ソースを作成したら、カスタム測地ポイントを追加できます。
private void addPointsToDataSource(PointDataSource pointDataSource) {
    // Prepare the geodetic point.
    GeoCoordinates geoPoint = new GeoCoordinates(pointGeoLatitude, pointGeoLongitude);

    // Optional: Prepare a list of custom attributes.
    DataAttributes pointAttributes = new DataAttributesBuilder().with("id", "my first point").build();

    // Add the point to data source.
    pointDataSource.add(new PointDataBuilder().withCoordinates(geoPoint)
                                              .withAttributes(pointAttributes)
                                              .build());

    // Repeat above steps to add more custom points to the data source.
    // Alternatively, use `PointDataSource.add` to add multiple custom points with a single call.
    ...
}
ポイント レイヤーのカスタム スタイルを準備します。
注以降の手順では、スタイル文字列の
layer値はMapLayerに付けた名前と一致している必要があります。この例で使われているdataSourceNameはMyCustomPointsで、レイヤー名はMyCustomPointsLayerです。
private final static String MY_CUSTOM_LAYER_STYLE =
    "{\n"
    + "  \"styles\": [\n"
    + "    {\n"
    + "      \"layer\": \"MyCustomPointsLayer\",\n"
    + "      \"technique\": \"icon-text\",\n"
    + "      \"attr\": {\n"
    + "        \"icon-source\": \"my_icon.png\"\n"
    + "      }\n"
    + "    }\n"
    + "  ]\n"
    + "}";

private Style createCustomStyle() {
    try {
        return JsonStyleFactory.createFromString(MY_CUSTOM_LAYER_STYLE);
    } catch (JsonStyleFactory.InstantiationException) {
        // Custom exception handling.
        ...
    }

    return null;
}
地図上に PointDataSource を表示するには、MapLayer を次のように構築します。
private MapLayer createMapLayer(String dataSourceName, Style layerStyle) {
    // Set the layer to be rendered on top of other layers.
    MapLayerPriority priority = new MapLayerPriorityBuilder().renderedLast().build();
    // And it should be visible for all zoom levels. The minimum tilt level is 0 and maximum zoom level is 23.
    MapLayerVisibilityRange range = new MapLayerVisibilityRange(MapCameraLimits.MIN_TILT, MapCameraLimits.MAX_ZOOM_LEVEL);

    try {
        // Build and add the layer to the map.
        MapLayer mapLayer = new MapLayerBuilder()
                .forMap(mapView.getHereMap()) // mandatory parameter
                .withName(dataSourceName + "Layer") // mandatory parameter
                .withDataSource(dataSourceName, MapContentType.POINT)
                .withPriority(priority)
                .withVisibilityRange(range)
                .withStyle(layerStyle)
                .build();
        return mapLayer;
    } catch (MapLayerBuilder.InstantiationException e) {
        throw new RuntimeException(e.getMessage());
    }
}
カスタム レイヤーにカスタム データ属性を追加する
測地線などのカスタム オブジェクトは、属性のセットと関連付けできます。このような属性は一般的なキー/値のペアで、ディベロッパーが自由に定義できます。
たとえば、このようなユーザー定義の属性を使用して、各オブジェクトに一意の識別子をタグ付けできます。
DataAttributes lineAttributes = new DataAttributesBuilder().with("id", "my first line").build();また、スタイル式と合わせて使用して、地図の上に表示する際に各オブジェクトの外観をカスタマイズできます。
// Define a layer style string that would use per-line object width and color values
// that are stored inside line custom data attributes. For that purpose, the 'get' expression is used.
private final static String MY_CUSTOM_LAYER_STYLE =
    "{\n"
    + "  \"styles\": [\n"
    + "    {\n"
    + "      \"layer\": \"MyCustomLinesLayer\",\n"
    + "      \"technique\": \"line\",\n"
    + "      \"attr\": {\n"
    + "        \"width\": [\"get\", \"lineWidthInMeters\"]\n",
    + "        \"color\": [\"to-color\",[\"get\", \"lineColor\"]]\n"
    + "      }\n"
    + "    }\n"
    + "  ]\n"
    + "}";

// Define specific values for "lineWidth" and "lineColor" per line object.
DataAttributes lineAttributes = new DataAttributesBuilder().with("lineWidthInMeters", 10.0)
                                                           .with("lineColor", "#ff0000ff").build();
...
カスタムタイルソースを追加する
ポイント、ライン、ポリゴンのタイルソースのサポートは高度な機能で、ユーザーが大量のカスタム地理空間データを統合して視覚化する必要があるシナリオ向けに設計されています。たとえば、世界中のEV充電ステーションや店舗の場所を視覚化する場合などです。MapMarkerやMapPolylineなどのAPIは小規模なデータセットには十分ですが、大規模な使用ではメモリ消費量が多くなるため非効率になります。また、PointDataSourceなどのカスタムデータソースを使用する、ポイント、ライン、ポリゴンのカスタムレイヤーも大量のデータには適していません。代わりに、この章で説明するように、PointTileDataSource、LineTileDataSource、PolygonTileDataSourceの使用を検討してください。
注データはタイル単位で読み込まれるため、データセット全体が一度にグローバルに読み込まれることはありません。
カスタムポイントタイルソースを追加する
カスタムポイントタイルソースを追加することにより、ポイントデータの追加レイヤーをデフォルトのHERE MapSchemeにレンダリングできるようになり、地図の外観をさらに改善できます。このアプローチにより、ポイントデータの形式がHERE SDKでネイティブにサポートされていない場合でも、ポイントデータのシームレスな統合が可能になります。
ポイントタイルデータソースは、施設情報 (POI)、リアルタイム車両追跡、イベントマーカーなどの場所の表示に使用できます。
注これはこの機能のベータリリースであるため、いくつかのバグや予期しない動作が発生する可能性があります。関連するAPIは、廃止のプロセスを経ずに、新しいリリースに変更される可能性があります。
カスタムポイントタイルソースを追加するには、PointTileDataSourceを作成する必要があります。PointTileDataSourceによりポイントタイルソースの作成が容易になる他、PointTileSourceはリクエストされたTileKeyに基づき、カスタムポイントデータを提供するメカニズムを備えています。JSONベースのスタイルを使用してカスタムポイントタイルソースの外観を制御し、地図に統合します。
PointTileDataSourceに加えて、MapLayerBuilderを使用してMapLayerを作成し、レンダリング可能なマップオーバーレイを地図に追加できます。
MapLayerVisibilityRangeを使用して、マップレイヤーのズームレベルを指定します。MapContentTypeを使用して、MapLayerによって表示されるデータ型を指定します。測地ポイントの場合は、MapContentType.POINTを使用します。StyleAPIを使用して、実行時にアイコンなどのプロパティを調整します。
次のようにPointTileDataSourceを作成します。
private MapView mapView;
private MapLayer pointMapLayer;
private PointTileDataSource pointDataSource;

public void onMapSceneLoaded(MapView mapView, Context context) {
    this.mapView = mapView;
    this.context = context;

    MapCamera camera = mapView.getCamera();
    MapMeasure mapMeasureZoom = new MapMeasure(MapMeasure.Kind.DISTANCE_IN_METERS, DEFAULT_DISTANCE_TO_EARTH_IN_METERS);
    camera.lookAt(new GeoCoordinates(52.530932, 13.384915), mapMeasureZoom);

    String dataSourceName = "MyPointTileDataSource";
    pointDataSource = createPointDataSource(dataSourceName);
    pointMapLayer = createMapLayer(dataSourceName);
}
次のように、カスタムポイントデータソースを作成し、タイルを読み込みます。
private PointTileDataSource createPointDataSource(String dataSourceName) {
    // Create a PointTileDataSource using a local point tile source.
    // Note that this will make the point source already known to the passed map view.
    return PointTileDataSource.create(mapView.getMapContext(), dataSourceName, new LocalPointTileSource());
}

@Override
public LoadTileRequestHandle loadTile(@NonNull TileKey tileKey,
                                    @NonNull LoadResultHandler loadResultHandler) {
    // For each tile, provide the tile geodetic center as a custom point, with a single
    // named attribute "pointText" containing the tile key representation as a string.
    DataAttributes pointAttributes = new DataAttributesBuilder()
            .with("pointText", String.format("Tile: (%d, %d, %d)",
                                            tileKey.x, tileKey.y, tileKey.level)).build();
    PointData tileData = new PointDataBuilder().withCoordinates(getTileCenter(tileKey))
                                            .withAttributes(pointAttributes)
                                            .build();
    loadResultHandler.loaded(tileKey, Arrays.asList(tileData), new TileMetadata(mDataVersion, new Date(0)));

    // No request handle is returned here since there is no asynchronous loading happening.
    return null;
}
次のように、ポイントタイルソースのカスタムスタイルを準備します。
注以降の手順では、スタイル文字列の
layer値はMapLayerに付けた名前と一致している必要があります。この例で使われているdataSourceNameはMyPointTileDataSourceで、レイヤー名はMyPointTileDataSourceLayerです。
private final static String LAYER_STYLE =
        "{\n"
        + "  \"styles\": [\n"
        + "    {\n"
        + "      \"layer\": \"MyPointTileDataSourceLayer\",\n"
        + "      \"technique\": \"icon-text\",\n"
        + "      \"attr\": {\n"
        + "        \"text-color\": \"#ff0000ff\",\n"
        + "        \"text-size\": 40,\n"
        + "        \"text\": [\"get\", \"pointText\"]\n"
        + "      }\n"
        + "    }\n"
        + "  ]\n"
        + "}";

private Style createCustomStyle() {
    try {
        return JsonStyleFactory.createFromString(LAYER_STYLE);
    } catch (JsonStyleFactory.InstantiationException e) {
        throw new RuntimeException(e);
    }
}
地図上に pointTileSource を表示するには、MapLayer を次のように構築します。
// Creates a MapLayer for displaying custom point tiles.
private MapLayer createMapLayer(String dataSourceName) {
    // The layer should be visible for all zoom levels. The minimum tilt level is 0 and maximum zoom level is 23.
    MapLayerVisibilityRange range = new MapLayerVisibilityRange(MapCameraLimits.MIN_TILT, MapCameraLimits.MAX_ZOOM_LEVEL);

    try {
        // Build and add the layer to the map.
        MapLayer mapLayer = new MapLayerBuilder()
                .forMap(mapView.getHereMap()) // mandatory parameter
                .withName(dataSourceName + "Layer") // mandatory parameter
                .withDataSource(dataSourceName, MapContentType.POINT)
                .withVisibilityRange(range)
                .withStyle(createCustomStyle())
                .build();
        return mapLayer;
    } catch (MapLayerBuilder.InstantiationException e) {
        throw new RuntimeException(e.getMessage());
    }
}
最終的にポイントタイルソースは次のように表示されます。
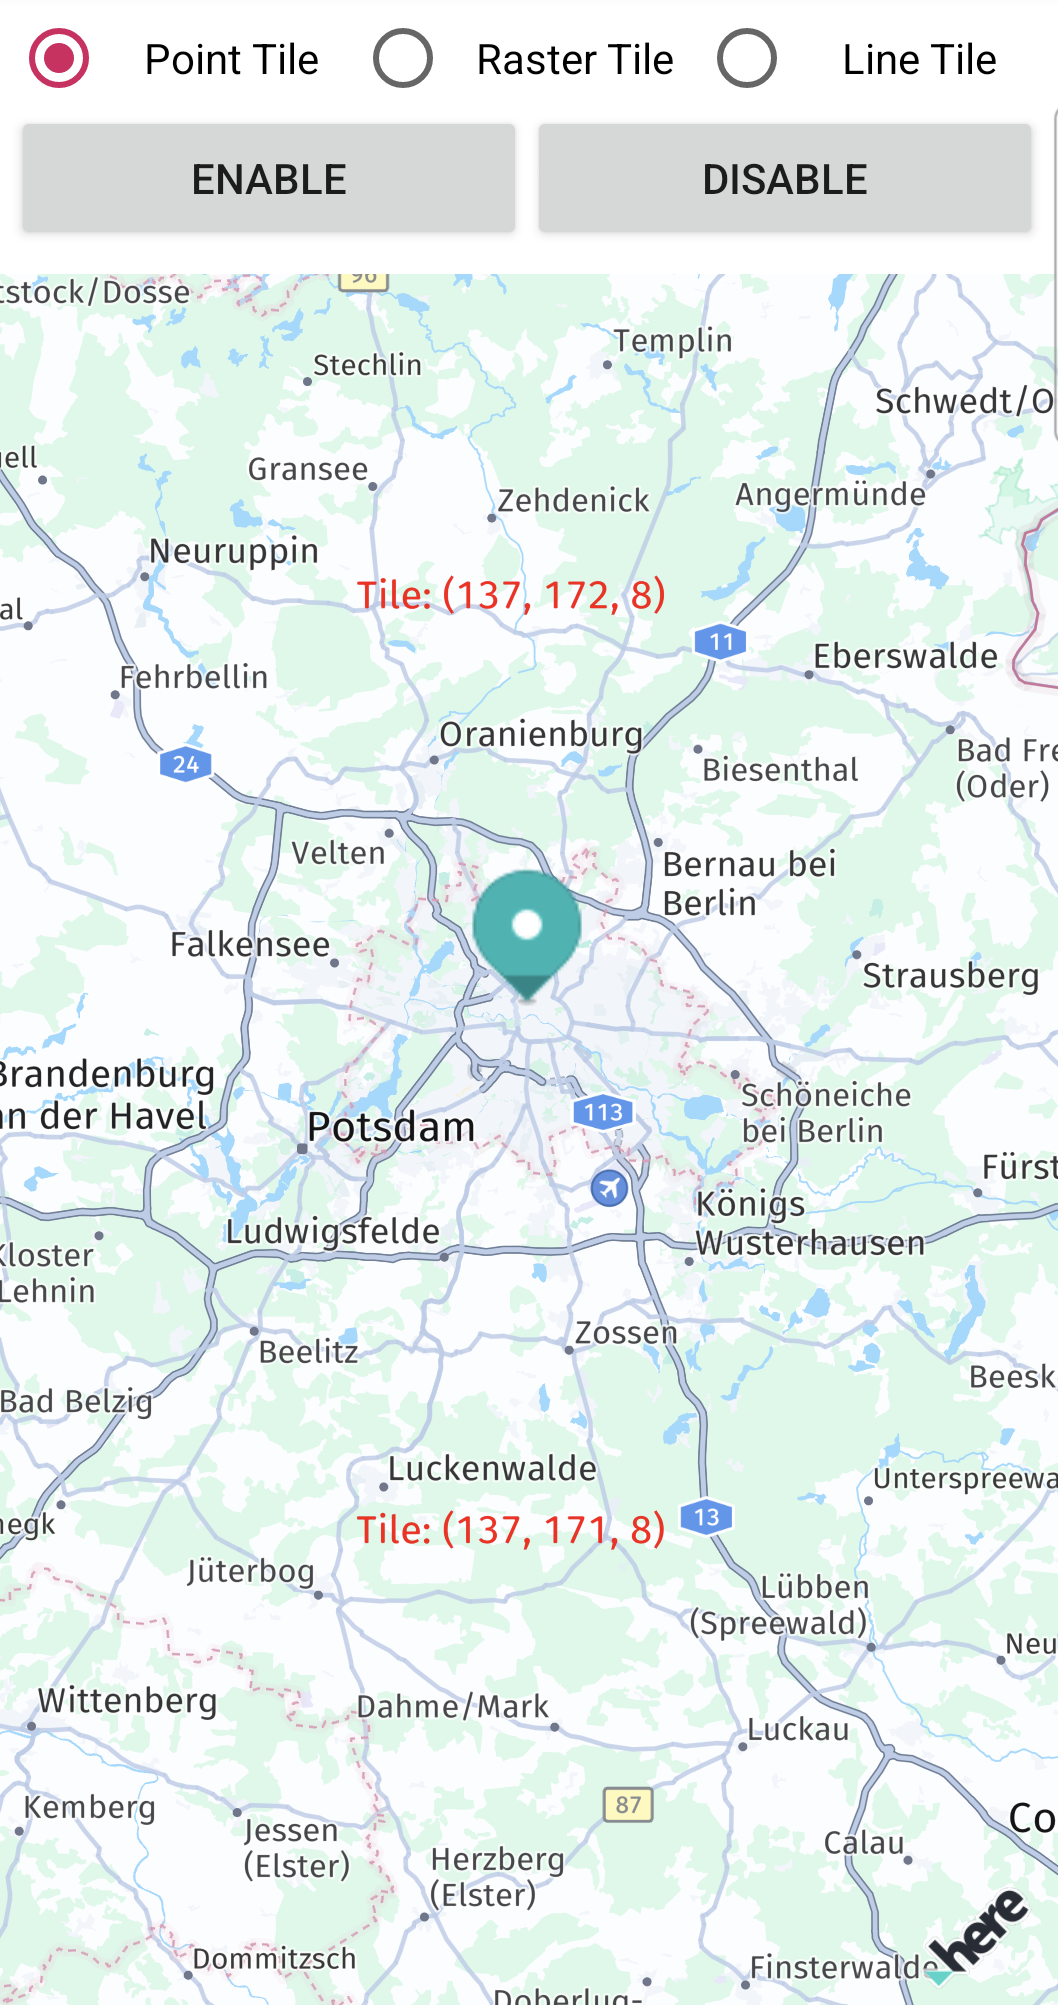
Screenshot: Showing point tile source.
カスタムラインタイルソースを追加する
カスタムラインタイルソースを追加することにより、ラインデータの追加レイヤーをデフォルトのHERE MapSchemeの上に重ねてレンダリングできるようになり、地図の外観をさらに改善できます。このアプローチにより、ラインデータの形式がHERE SDKでネイティブにサポートされていない場合でも、ラインデータのシームレスな統合が可能になります。
ラインタイルデータソースは、未舗装道路、境界線などのレンダリングに最適です。
注これはこの機能のベータリリースであるため、いくつかのバグや予期しない動作が発生する可能性があります。関連するAPIは、廃止のプロセスを経ずに、新しいリリースに変更される可能性があります。
カスタムラインタイルソースを追加するには、LineTileDataSourceを作成する必要があります。LineTileDataSourceによりラインタイルソースの作成が容易になる他、LineTileSourceはリクエストされたTileKeyに基づき、カスタムラインデータを提供するメカニズムを備えています。JSONベースのスタイルを使用してカスタムラインタイルソースの外観を制御し、地図に統合します。
LineTileDataSourceに加えて、MapLayerBuilderを使用してMapLayerを作成し、レンダリング可能なマップオーバーレイを地図に追加できます。
MapLayerVisibilityRangeを使用して、マップレイヤーのズームレベルを指定します。MapContentTypeを使用して、MapLayerによって表示されるデータ型を指定します。測地線の場合は、MapContentType.LINEを使用します。StyleAPIを使用して、実行時にアイコンなどのプロパティを調整します。
次のようにLineTileDataSourceを作成します。
private MapView mapView;
private MapLayer lineMapLayer;
private LineTileDataSource lineDataSource;

public void onMapSceneLoaded(MapView mapView, Context context) {
    this.mapView = mapView;
    this.context = context;

    MapCamera camera = mapView.getCamera();
    MapMeasure mapMeasureZoom = new MapMeasure(MapMeasure.Kind.ZOOM_LEVEL, 9);
    camera.lookAt(new GeoCoordinates(52.530932, 13.384915), mapMeasureZoom);
    String dataSourceName = "MyLineTileDataSource";
    lineDataSource = createLineDataSource(dataSourceName);
    lineMapLayer = createMapLayer(dataSourceName);

    if (lineMapLayer != null) {
        lineMapLayer.setEnabled(false);
        lineMapLayer.setStyle(createCustomStyle());
    }
}
次のように、カスタムラインデータソースを作成し、タイルを読み込みます。
private LineTileDataSource createLineDataSource(String dataSourceName) {
    Log.d(TAG, "Creating line data source: " + dataSourceName);
    return LineTileDataSource.create(mapView.getMapContext(), dataSourceName, new LocalLineTileSource());
}

@Override
public LoadTileRequestHandle loadTile(@NonNull TileKey tileKey, @NonNull LoadResultHandler loadResultHandler) {
    Log.d("LocalLineTileSource", "Loading tile for key: " + tileKey.toString());

    List<GeoCoordinates> lineCoordinates = getTileLineCoordinates(tileKey);
    if (lineCoordinates.isEmpty()) {
        Log.e("LocalLineTileSource", "No line coordinates generated for tile: " + tileKey);
        loadResultHandler.failed(tileKey);
        return null;
    }

    try {
        LineData tileData = new LineDataBuilder()
                .withGeometry(new GeoPolyline(lineCoordinates))
                .withAttributes(new DataAttributesBuilder().build())
                .build();
        Log.d("LocalLineTileSource", "Tile loaded successfully");
        loadResultHandler.loaded(tileKey, Collections.singletonList(tileData), new TileSource.TileMetadata(mDataVersion, new Date(0)));
    } catch (InstantiationErrorException e) {
        Log.e("LocalLineTileSource", "Failed to create LineData", e);
        loadResultHandler.failed(tileKey);
    }

    return null;
}
次のように、ラインタイルソースのカスタムスタイルを準備します。
注以降の手順では、スタイル文字列の
layer値はMapLayerに付けた名前と一致している必要があります。この例で使われているdataSourceNameはMyLineTileDataSourceで、レイヤー名はMyLineTileDataSourceLayerです。
private static final String LAYER_STYLE = "{ \n" +
        "  \"styles\": [ \n" +
        "    { \n" +
        "      \"layer\": \"MyLineTileDataSourceLayer\", \n" +
        "      \"technique\": \"line\", \n" +
        "      \"attr\": { \n" +
        "        \"color\": \"#FF0000\", \n" +
        "        \"width\": [\"world-scale\", 5]\n" +
        "      } \n" +
        "    } \n" +
        "  ] \n" +
        "}\n";

private Style createCustomStyle() {
    try {
        return JsonStyleFactory.createFromString(LAYER_STYLE);
    } catch (JsonStyleFactory.InstantiationException e) {
        Log.e(TAG, "Failed to create style: " + e.getMessage());
        throw new RuntimeException(e);
    }
}
地図上に lineTileSource を表示するには、MapLayer を次のように構築します。
private MapLayer createMapLayer(String dataSourceName) {
    // The layer should be visible for all zoom levels. The minimum tilt level is 0 and maximum zoom level is 23.
    MapLayerVisibilityRange range = new MapLayerVisibilityRange(MapCameraLimits.MIN_TILT, MapCameraLimits.MAX_ZOOM_LEVEL);

    try {
        return new MapLayerBuilder()
                .forMap(mapView.getHereMap())
                .withName(dataSourceName + "Layer")
                .withDataSource(dataSourceName, MapContentType.LINE)
                .withVisibilityRange(range)
                .withStyle(createCustomStyle())
                .build();
    } catch (MapLayerBuilder.InstantiationException e) {
        Log.e(TAG, "Failed to create map layer: " + e.getMessage());
        return null;
    }
}
最終的にポイントタイルソースは次のように表示されます。
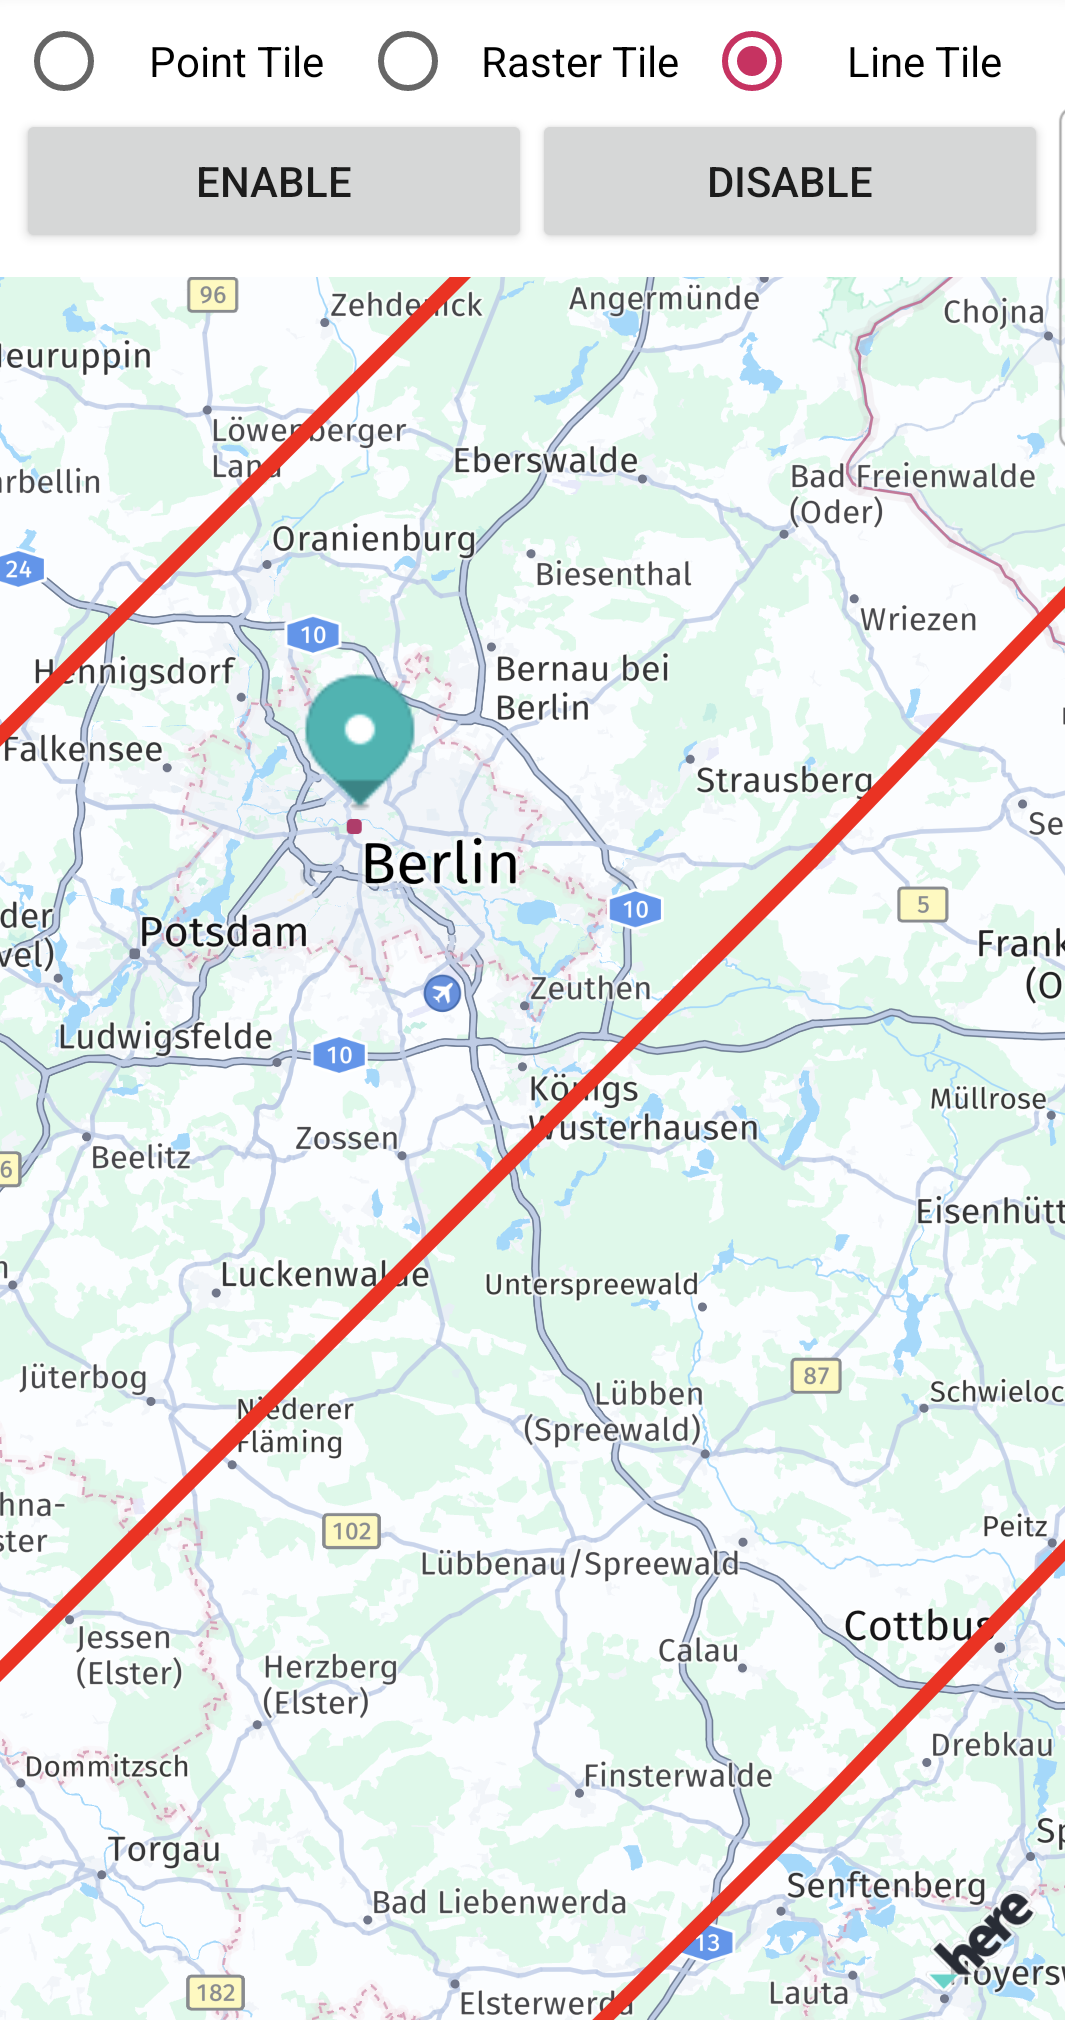
Screenshot: Showing line tile source.
カスタムラスタータイルソースを追加する
カスタムラスタータイルソースを追加することにより、ラスターデータの追加レイヤーをデフォルトのHERE MapSchemeの上に重ねてレンダリングできるようになり、地図の外観をさらに改善できます。このアプローチにより、ラスターデータの形式がHERE SDKでネイティブにサポートされていない場合でも、ラスターデータのシームレスな統合が可能になります。
ラスタータイルソースを使うと、衛星画像、天気図などの画像ベースのデータをオーバーレイできます。
注これはこの機能のベータリリースであるため、いくつかのバグや予期しない動作が発生する可能性があります。関連するAPIは、廃止のプロセスを経ずに、新しいリリースに変更される可能性があります。
カスタムラスタータイルソースを追加するには、RasterDataSourceを作成する必要があります。RasterDataSourceによりラスターデータソースの作成が容易になる他、RasterTileSourceはリクエストされたTileKeyに基づき、カスタムラスターデータを提供するメカニズムを備えています。JSONベースのスタイルを使用してカスタムラスタータイルソースの外観を制御し、地図に統合します。
RasterDataSourceに加えて、MapLayerBuilderを使用してMapLayerを作成し、レンダリング可能なマップオーバーレイを地図に追加できます。
MapLayerVisibilityRangeを使用して、マップレイヤーのズームレベルを指定します。MapContentTypeを使用して、MapLayerによって表示されるデータ型を指定します。測地ラスターの場合は、MapContentType.RASTER_IMAGEを使用します。StyleAPIを使用して、実行時にアイコンなどのプロパティを調整します。
次のようにRasterDataSourceを作成します。
private MapView mapView;
private MapLayer rasterMapLayerStyle;
private RasterDataSource rasterDataSourceStyle;

public void onMapSceneLoaded(MapView mapView, Context context) {
    this.mapView = mapView;
    this.context = context;

    MapCamera camera = mapView.getCamera();
    MapMeasure mapMeasureZoom = new MapMeasure(MapMeasure.Kind.DISTANCE_IN_METERS, DEFAULT_DISTANCE_TO_EARTH_IN_METERS);
    camera.lookAt(new GeoCoordinates(52.530932, 13.384915), mapMeasureZoom);

    String dataSourceName = "myRasterDataSourceStyle";
    rasterDataSourceStyle = createRasterDataSource(dataSourceName);
    rasterMapLayerStyle = createMapLayer(dataSourceName);

    // We want to start with the default map style.
    rasterMapLayerStyle.setEnabled(false);

    // Add a POI marker
    addPOIMapMarker(new GeoCoordinates(52.530932, 13.384915));
}
次のように、カスタムラスターデータソースを作成します。
private RasterDataSource createRasterDataSource(String dataSourceName) {
    // Create a RasterDataSource over a local raster tile source.
    // Note that this will make the raster source already known to the passed map view.
    return new RasterDataSource(mapView.getMapContext(), dataSourceName, new LocalRasterTileSource());
}

@Override
public LoadTileRequestHandle loadTile(@NonNull TileKey tileKey,
                                    @NonNull LoadResultHandler loadResultHandler) {
    // Pick one of the local tile images, based on the tile key x component.
    loadResultHandler.loaded(tileKey, mTileData.get(tileKey.x % mTileData.size()),
            new TileMetadata(mDataVersion, new Date(0)));

    // No request handle is returned here since there is no asynchronous loading happening.
    return null;
}
地図上に rasterTileSource を表示するには、MapLayer を次のように構築します。
private MapLayer createMapLayer(String dataSourceName) {
    // The layer should be rendered on top of other layers except the "labels" layer
    // so that we don't overlap the raster layer over POI markers.
    MapLayerPriority priority = new MapLayerPriorityBuilder().renderedBeforeLayer("labels").build();

    // And it should be visible for all zoom levels. The minimum tilt level is 0 and maximum zoom level is 23.
    MapLayerVisibilityRange range = new MapLayerVisibilityRange(MapCameraLimits.MIN_TILT, MapCameraLimits.MAX_ZOOM_LEVEL);

    try {
        // Build and add the layer to the map.
        MapLayer mapLayer = new MapLayerBuilder()
                .forMap(mapView.getHereMap()) // mandatory parameter
                .withName(dataSourceName + "Layer") // mandatory parameter
                .withDataSource(dataSourceName, MapContentType.RASTER_IMAGE)
                .withPriority(priority)
                .withVisibilityRange(range)
                .build();
        return mapLayer;
    } catch (MapLayerBuilder.InstantiationException e) {
        throw new RuntimeException(e.getMessage());
    }
}
最終的にラスタータイルソースは次のように表示されます。
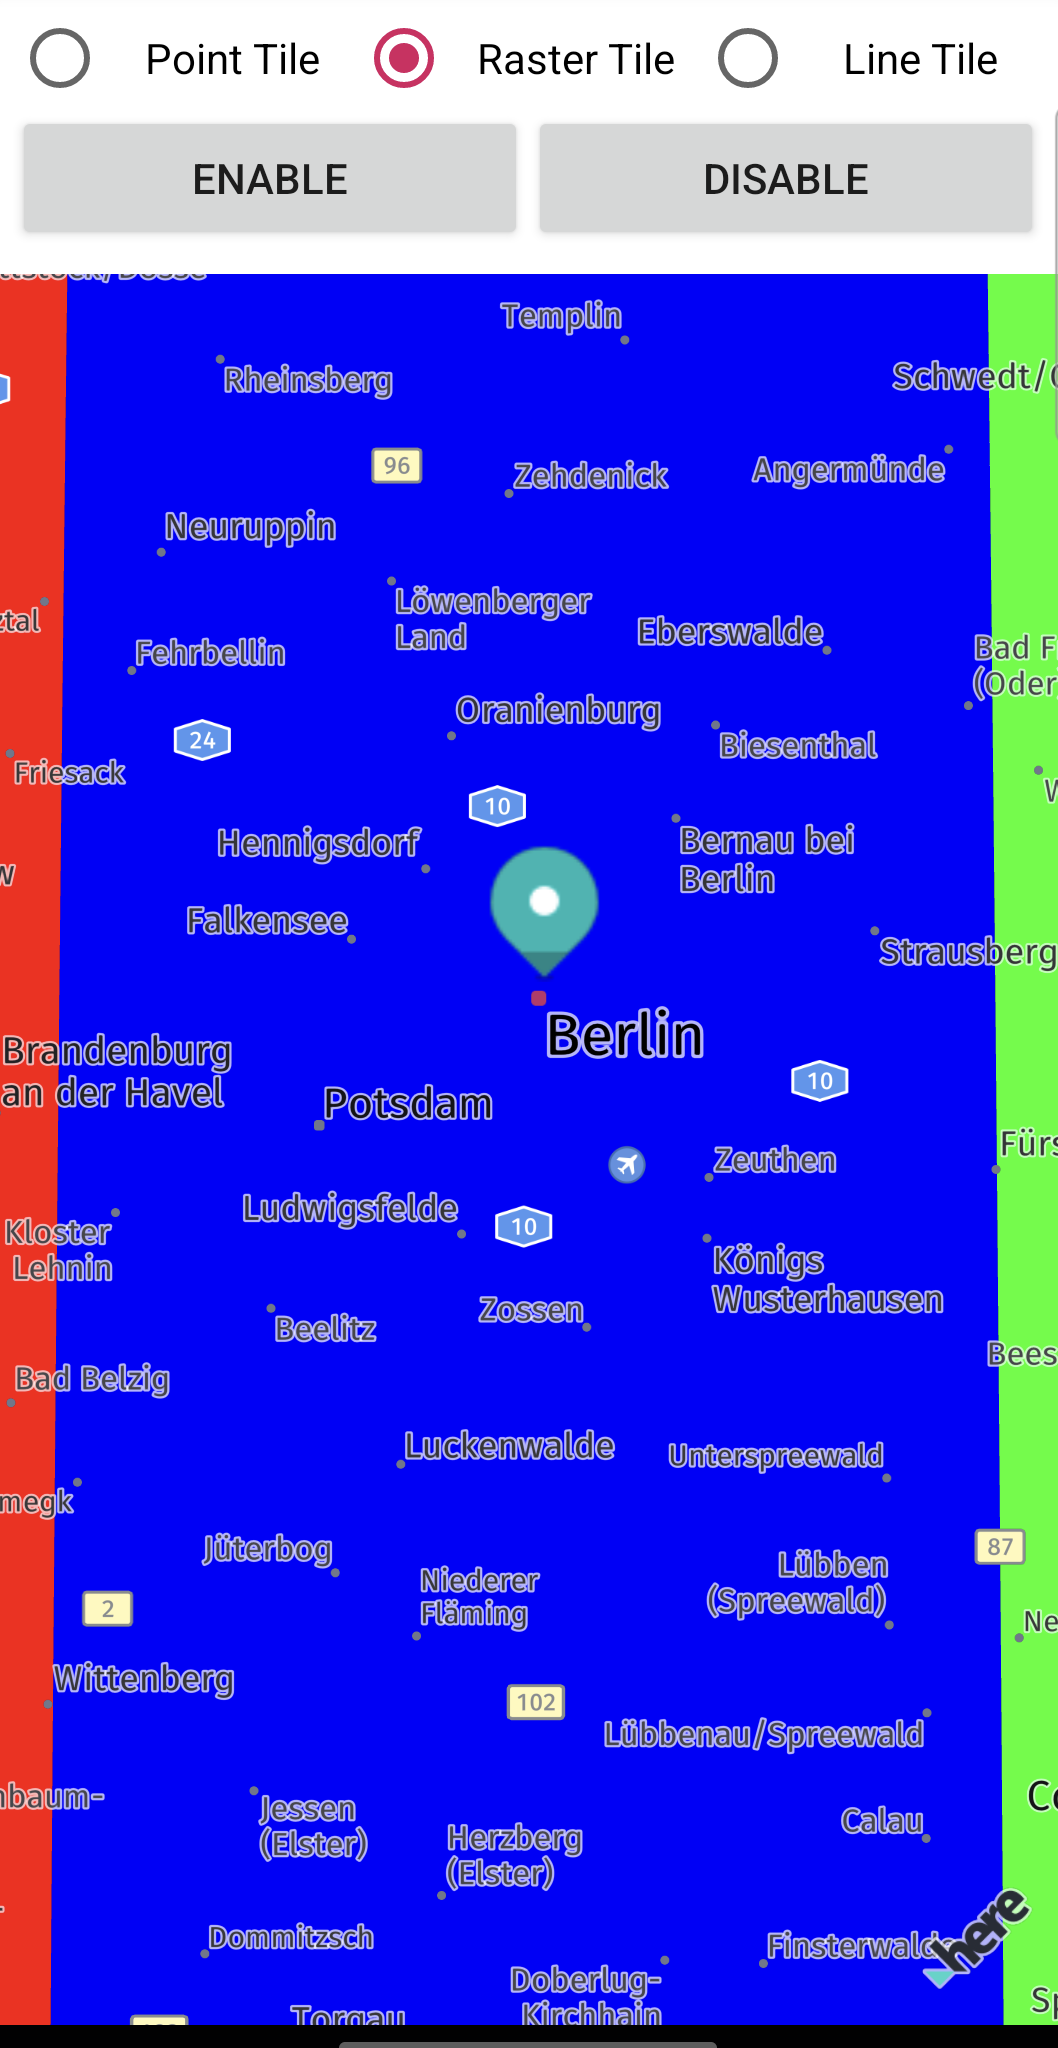
Screenshot: Showing raster tile source.
注カスタム道路ジオメトリーまたはPOI (施設情報) を作成するには、HEREのサポートと、HEREとの追加契約が必要です。詳細については、HERE担当者にお問い合わせください。「カスタムマップカタログ」も参照してください。
サンプルアプリを試す
上のコードスニペットの多くは、「CustomRasterLayers」と「CustomTileSource」のサンプルアプリから取得できます。このサンプルアプリは、GitHubでお好みのプラットフォームのものを見つけることができます。
Related Topics
2 か月前の更新