Library modules overview
This chapter provides an overview of the main HERE Data Inspector Library modules. For a full list of Data Inspector Library components, see the Data Inspector Library API Reference.
UI Components
@here/interactive-mapview-ui: A package that contains core Data Inspector Library UI components:-
DataInspector: A configurable UI widget that combines theMapViewclass with multiple widgets.DataInspectorrepresents the main Data Inspector window that you can access from the portal or when running Data Inspector Library example applications.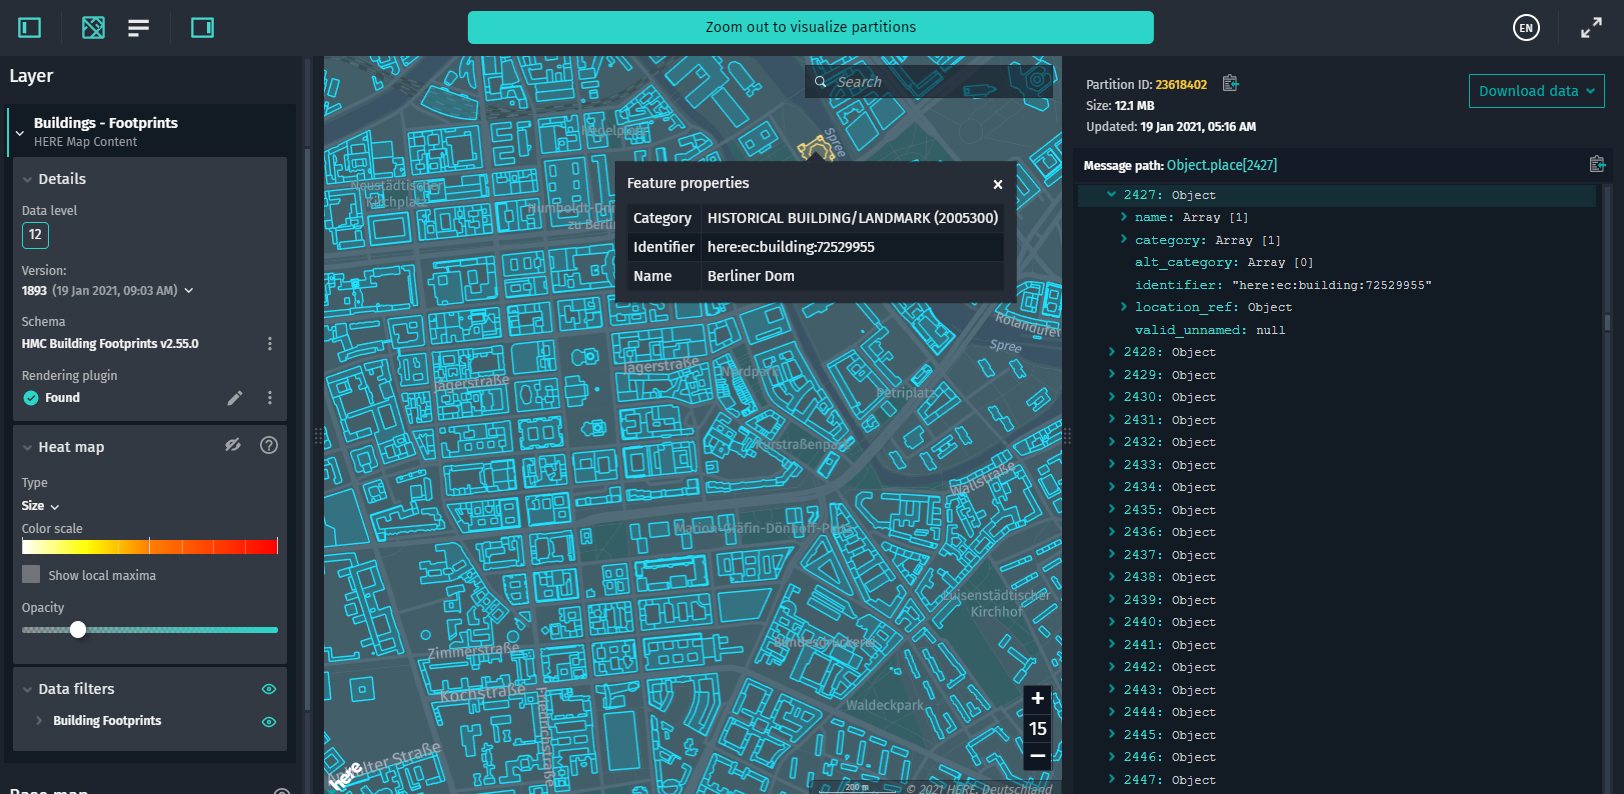
-
DecodedPanel: A UI widget that allows displaying decoded partition data, partition ID, partition size, and the timestamp of the last update of the data contained in a selected partition(s) (for versioned layers only). This widget also displays the Download data button. For a selected partition, this button allows downloading raw data, data decoded with the linked Protobuf schema, and GeoJSON data translated with the rendering plugin.Any errors that may occur during the partition data decoding process are also displayed in this panel.
The
DecodedPanelwidget includes a resize handle that allows you to resize the panel horizontally.When you select a certain feature of a data source in the map view, the
DecodedPanelhighlights the data for this specific feature.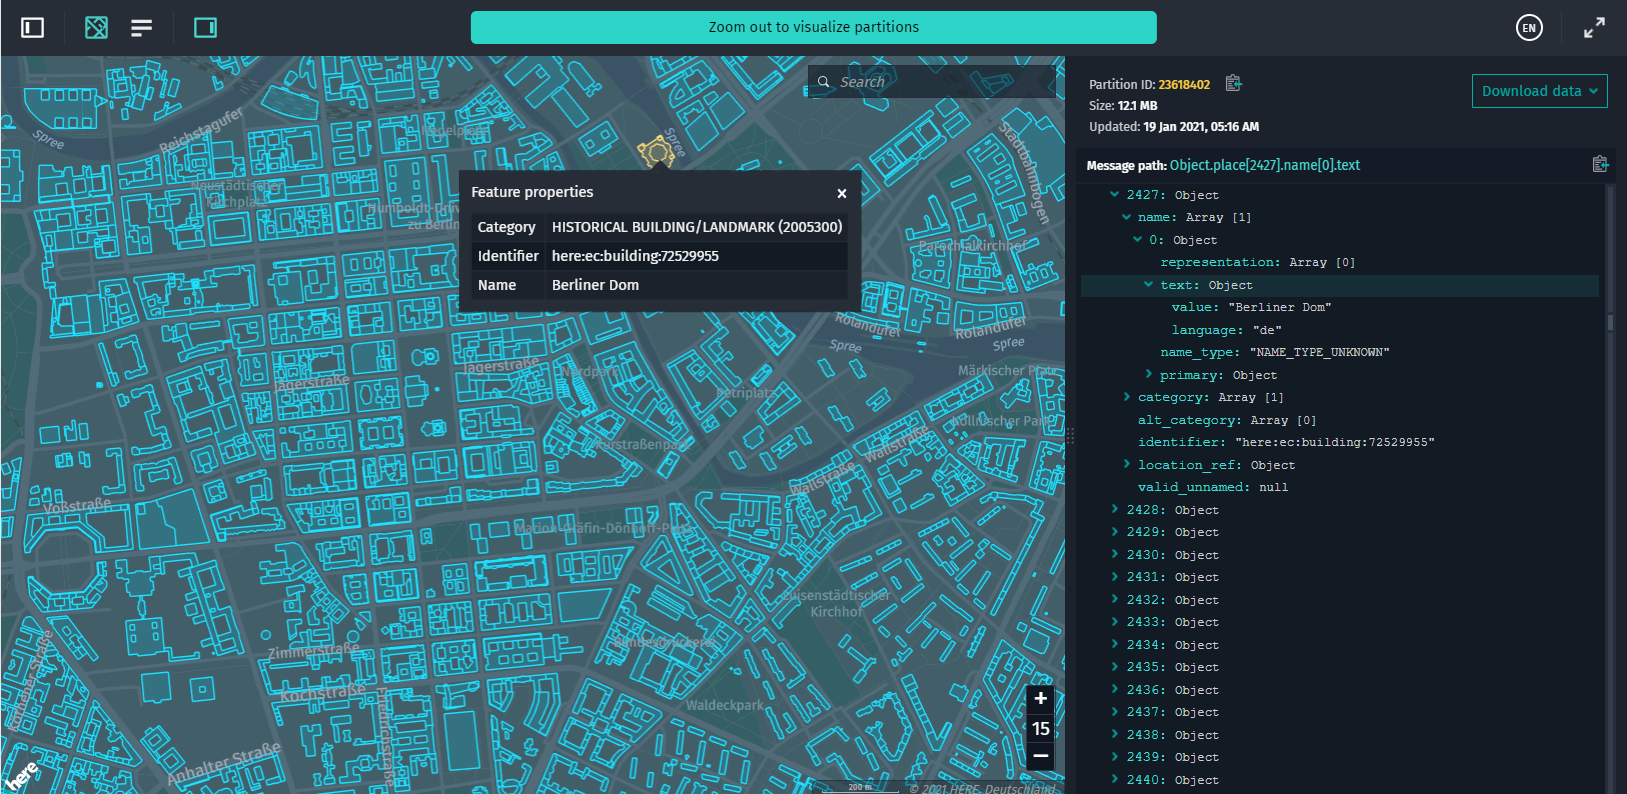
-
ControlPanel: A UI element that serves as a container for other widgets, such asUserAuthFormorInteractiveFilteringControl.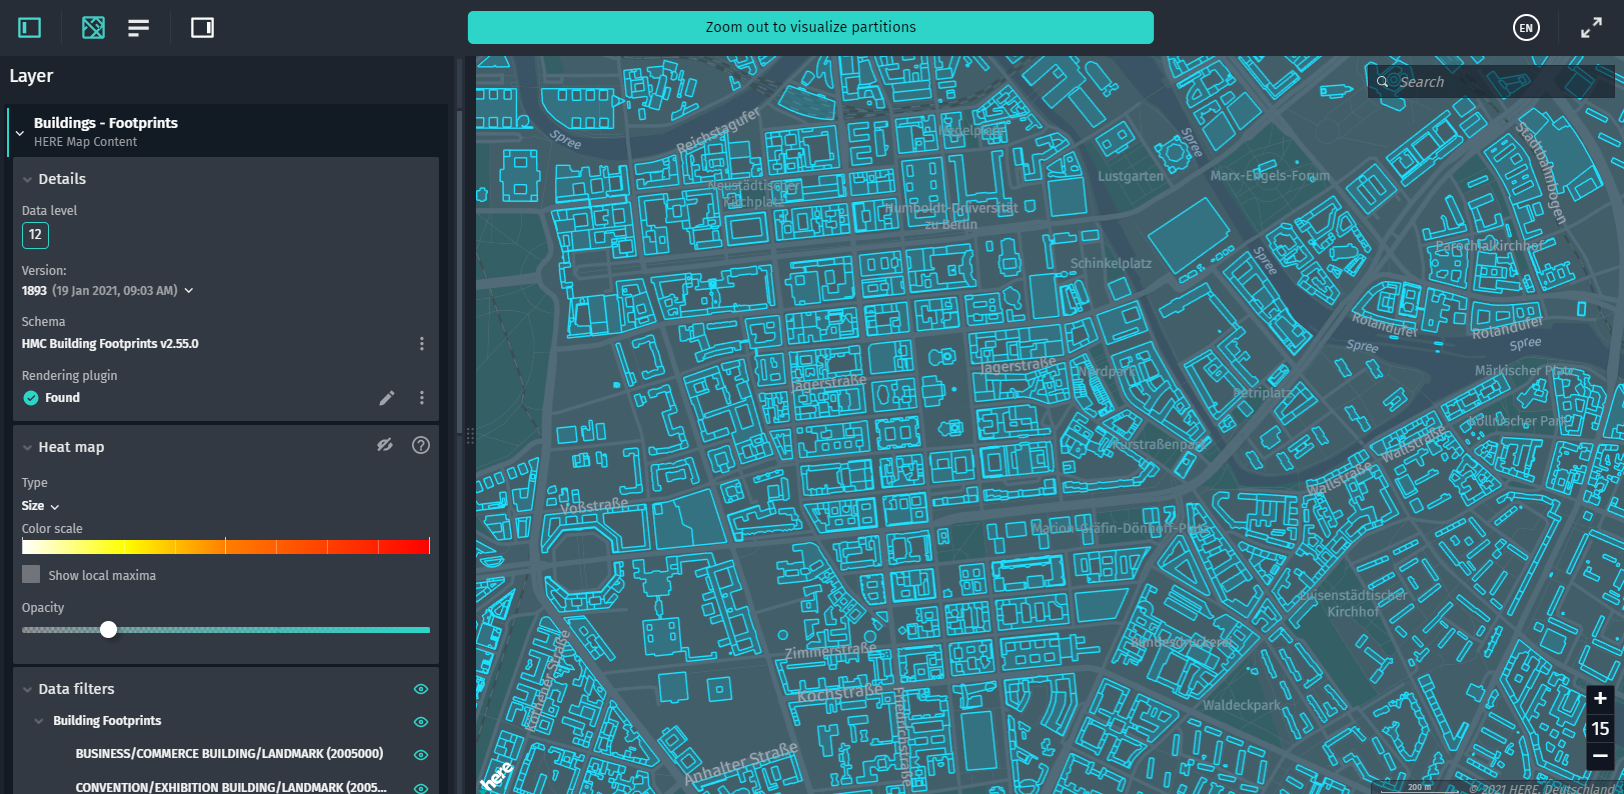
-
ToolBar: A UI widget with various controls for the map and data sources. This widget is commonly used as part of theDataInspectorclass, but you can also use theToolBarclass as a standalone component. The toolbar may contain buttons for showing and hiding the Control Panel, Map View, Partitions List, and Decoded Panel, as well as the language switcher and a full screen button.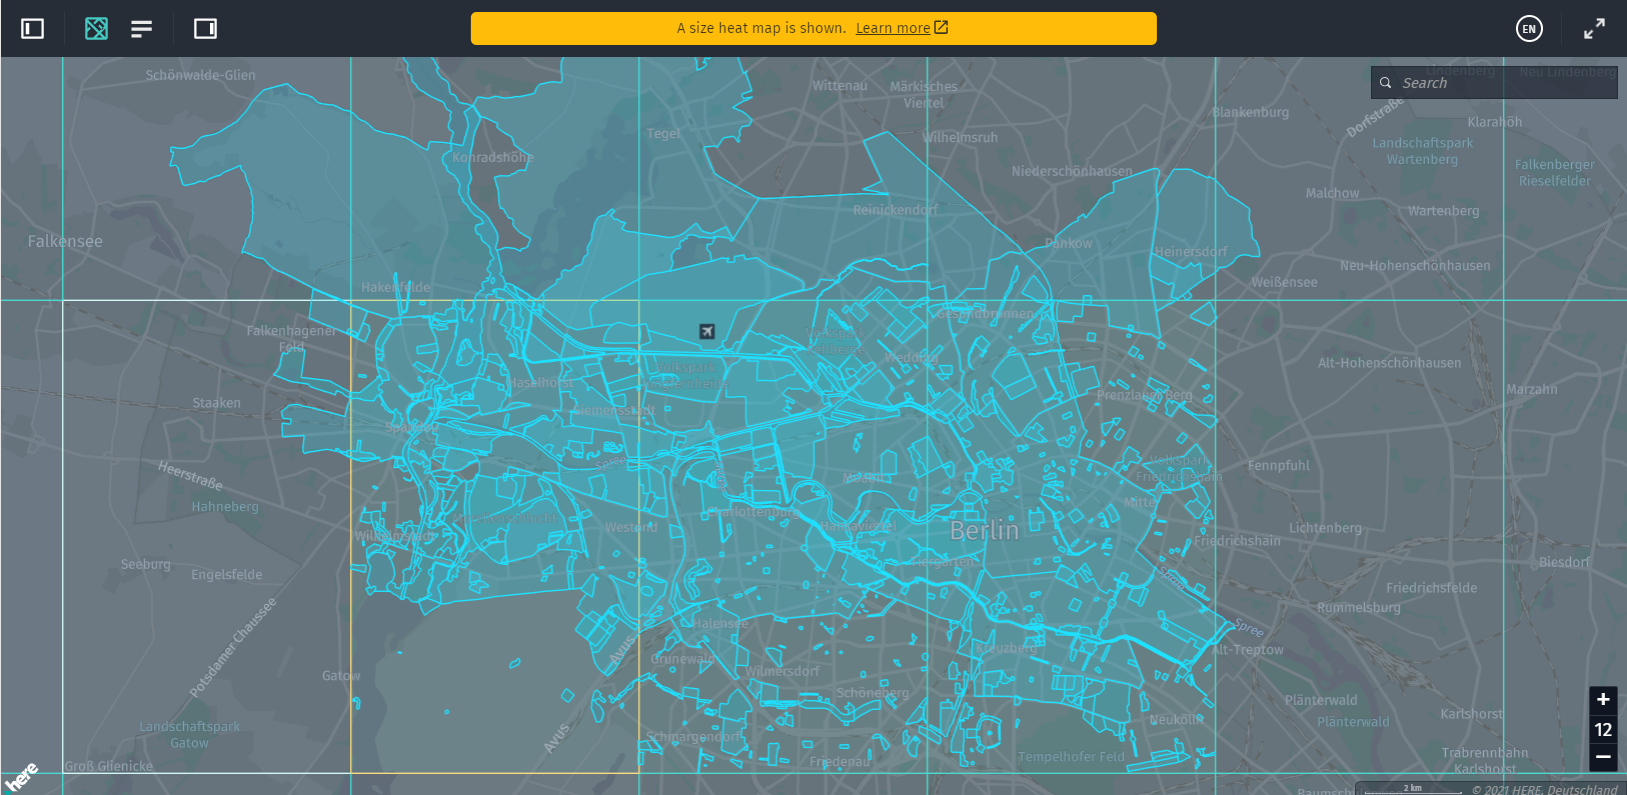
-
InteractiveFilteringControl: A UI component that allows showing or hiding specific features of a data source.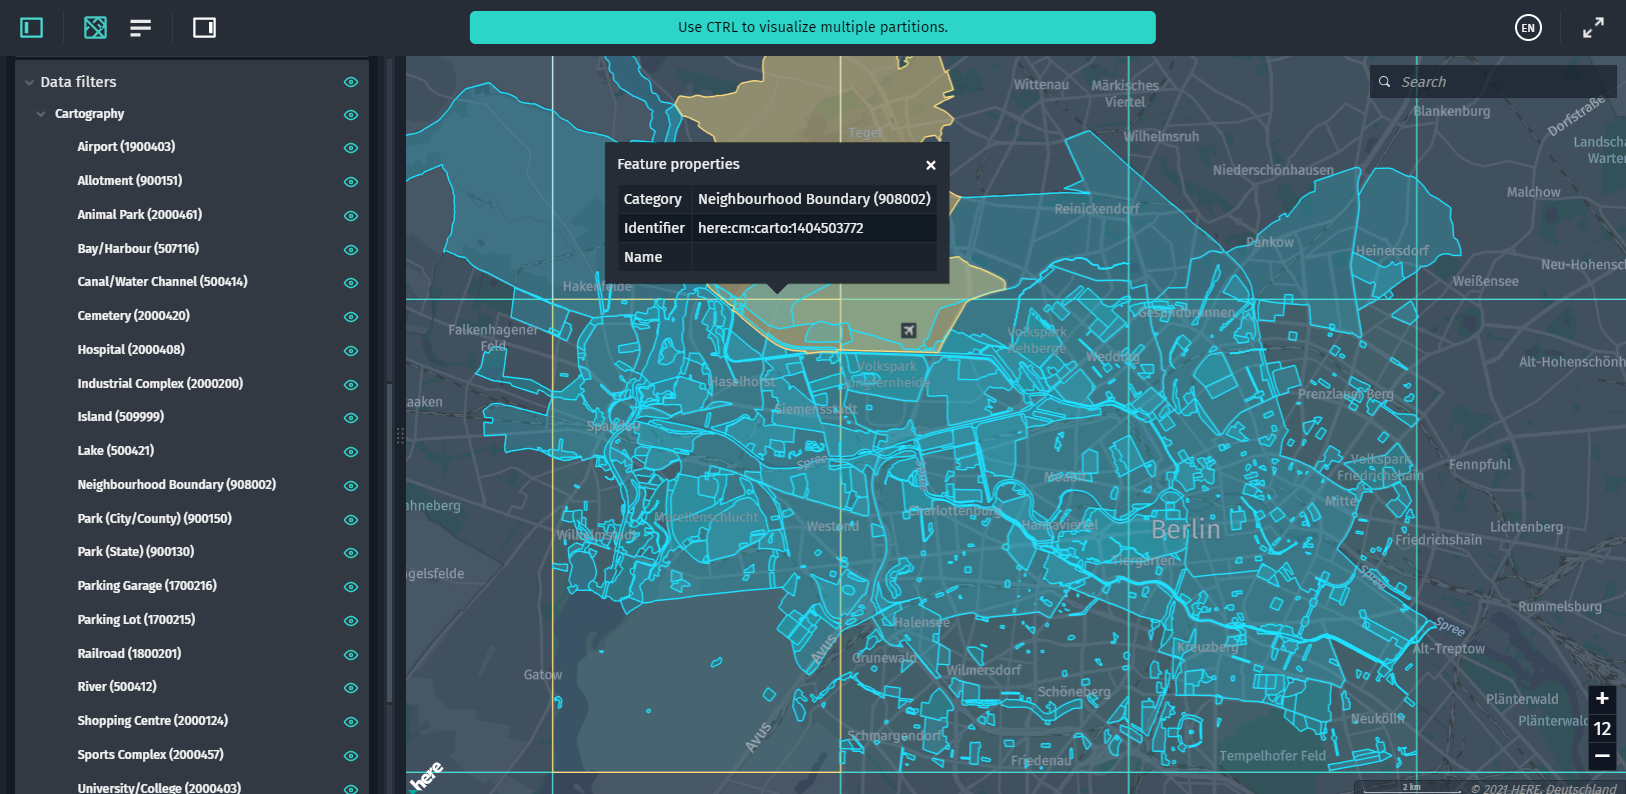
-
InfoPanel: This class is used to display an infopopup that shows a detailed list of feature properties (as key-value pairs) on click. To define the details you want to show in the infopopup, use thedescriptionstyle property of a GeoJSON object.descriptioncan be applied to any geometry type. To implement this control, use theinstallInfoWidgetsmethod (import { installInfoWidgets } from "@here/interactive-mapview-ui/lib/Utils";).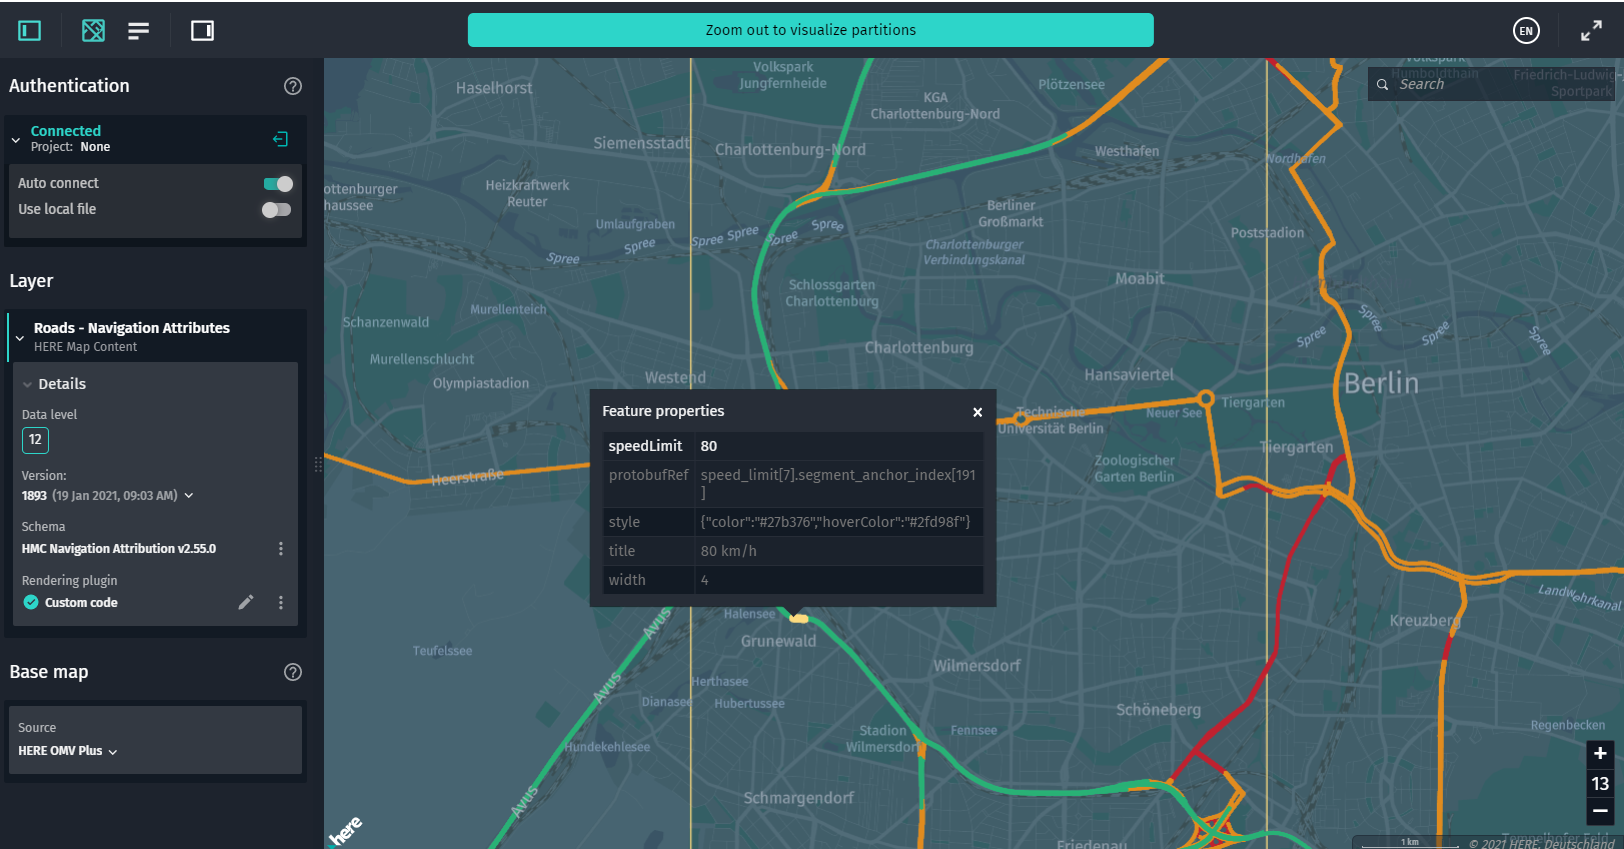
-
InfoTooltip: This class is used to display short info in a tooltip on a visualized feature on hover. To define the details you want to show in the tooltip, use thetitlestyle property of a GeoJSON object.titlecan be applied to any geometry type. To implement this control, use theinstallInfoWidgetsmethod (import { installInfoWidgets } from "@here/interactive-mapview-ui/lib/Utils";).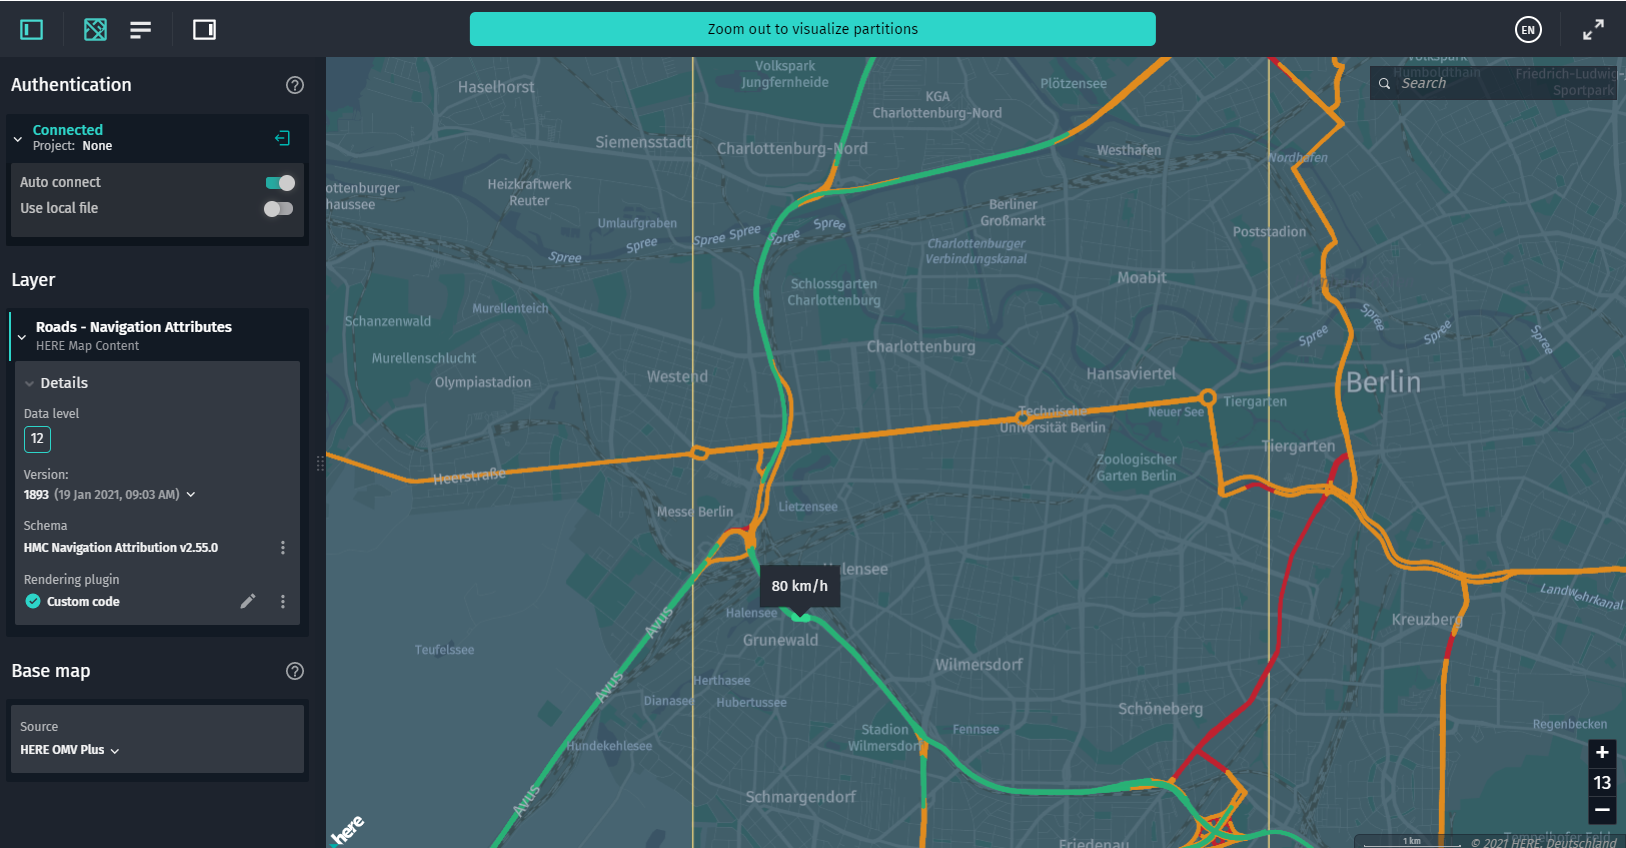
-
InteractiveStatsPanel: A UI component that displays runtime information from connected data sources. For example, you can see what events were triggered, or get statistics on how long it takes to download and decode partition data.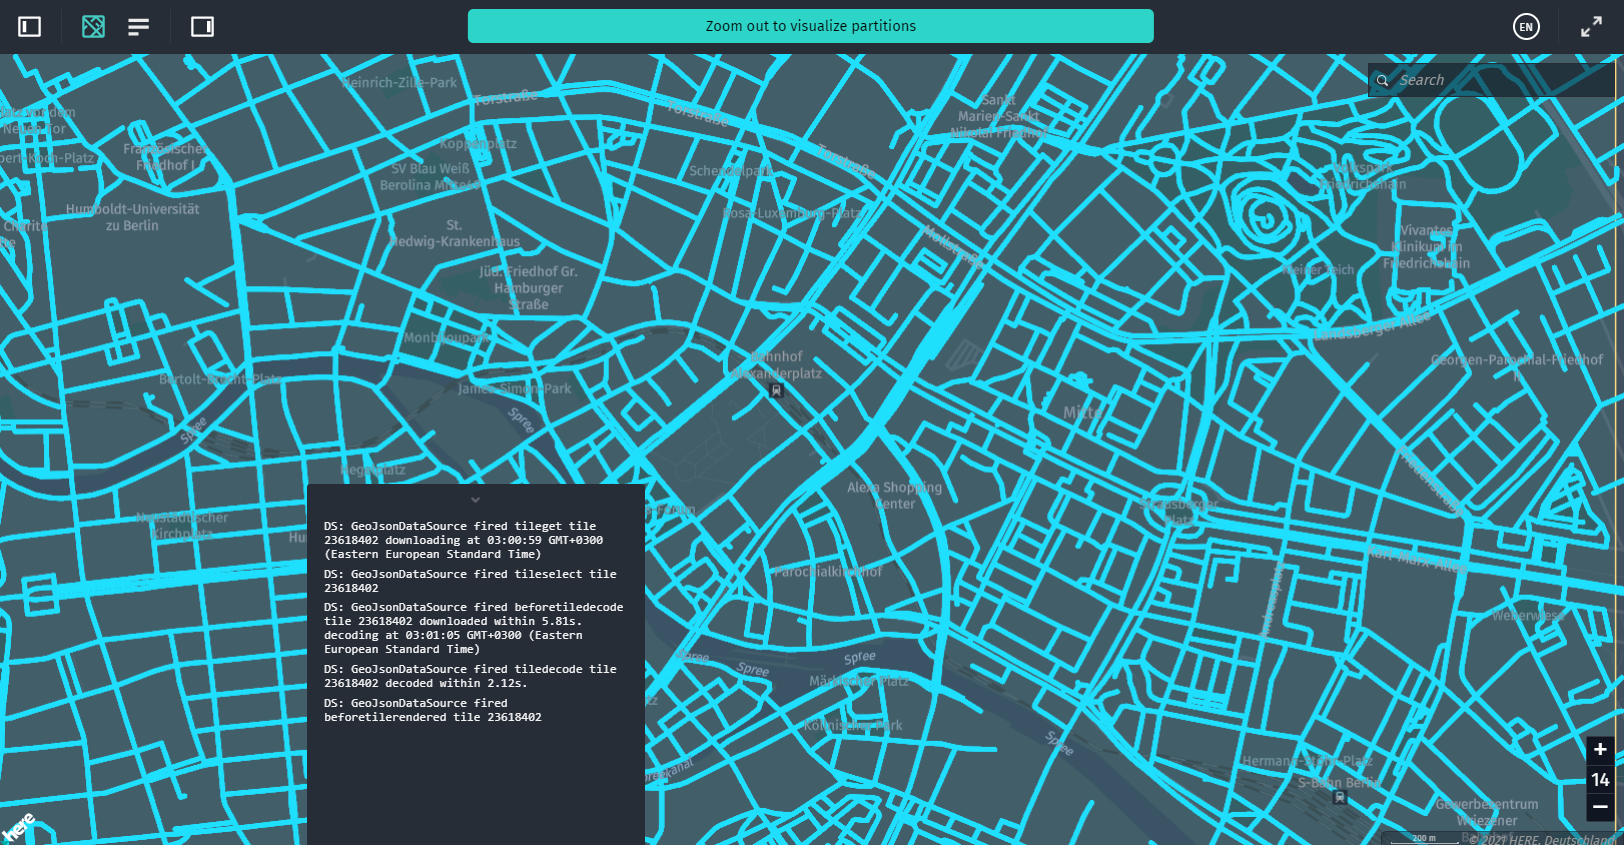
-
UserAuthForm: A UI form that allows you to enter your platform credentials. You can use it along with the@here/olp-sdk-authenticationmodule (theUserAuthclass) to provide data sources with a valid access token.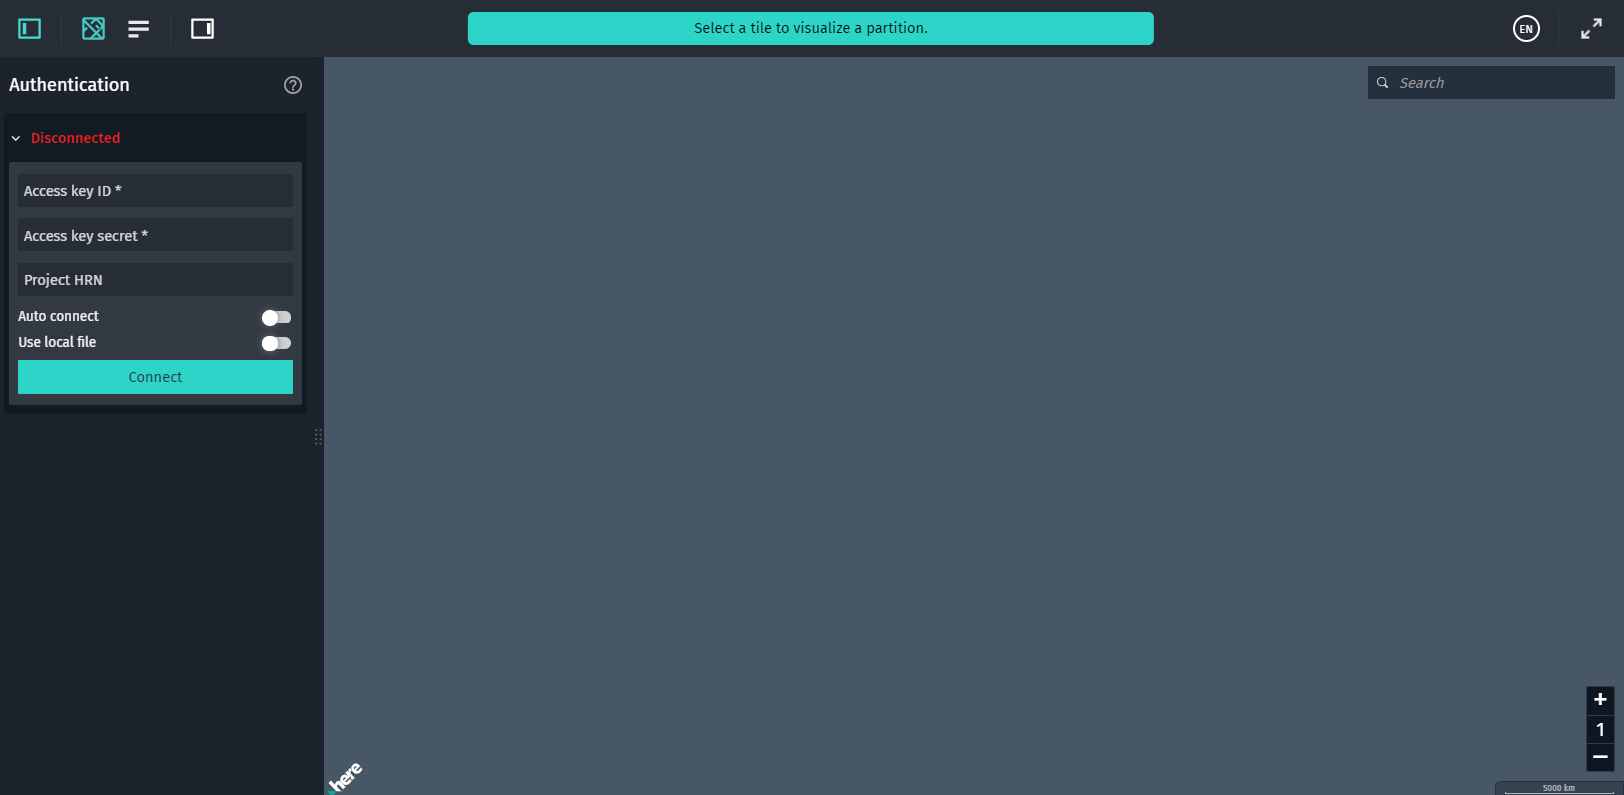
-
ZoomLevelWidget: A UI widget that shows the currentMapViewzoom level and allows you to switch between zoom levels.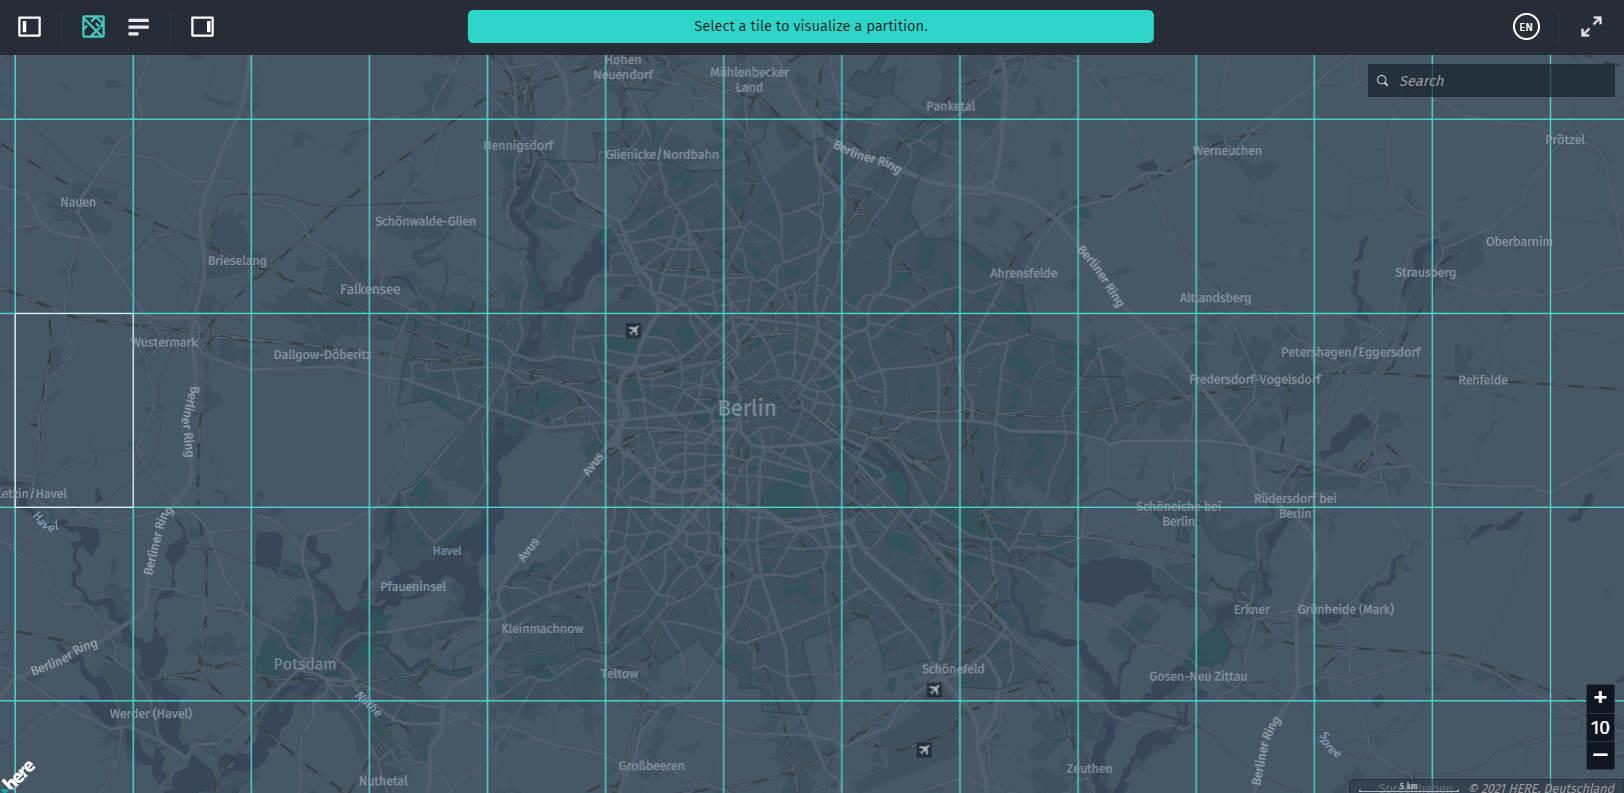
-
Note:
You can also use double-click zooming functionality integrated into the
DataInspector. By double-clicking in the map view, the map is zoomed in by one level, and by right-double-clicking in the map view, the map is zoomed out by one level. The location that you click, in this case, stays in the same screen position under the mouse cursor.
-
RenderingSettings: A UI widget with a set of controls that allow you to quickly develop and run rendering plugins for both custom and default layer schemas. For more information, see the Create Rendering Plugins chapter. -
RenderingPluginEditorMonaco: A component that uses Monaco Editor for live JavaScript syntax check and autocompletion. For more information, see the Create Rendering Plugins chapter.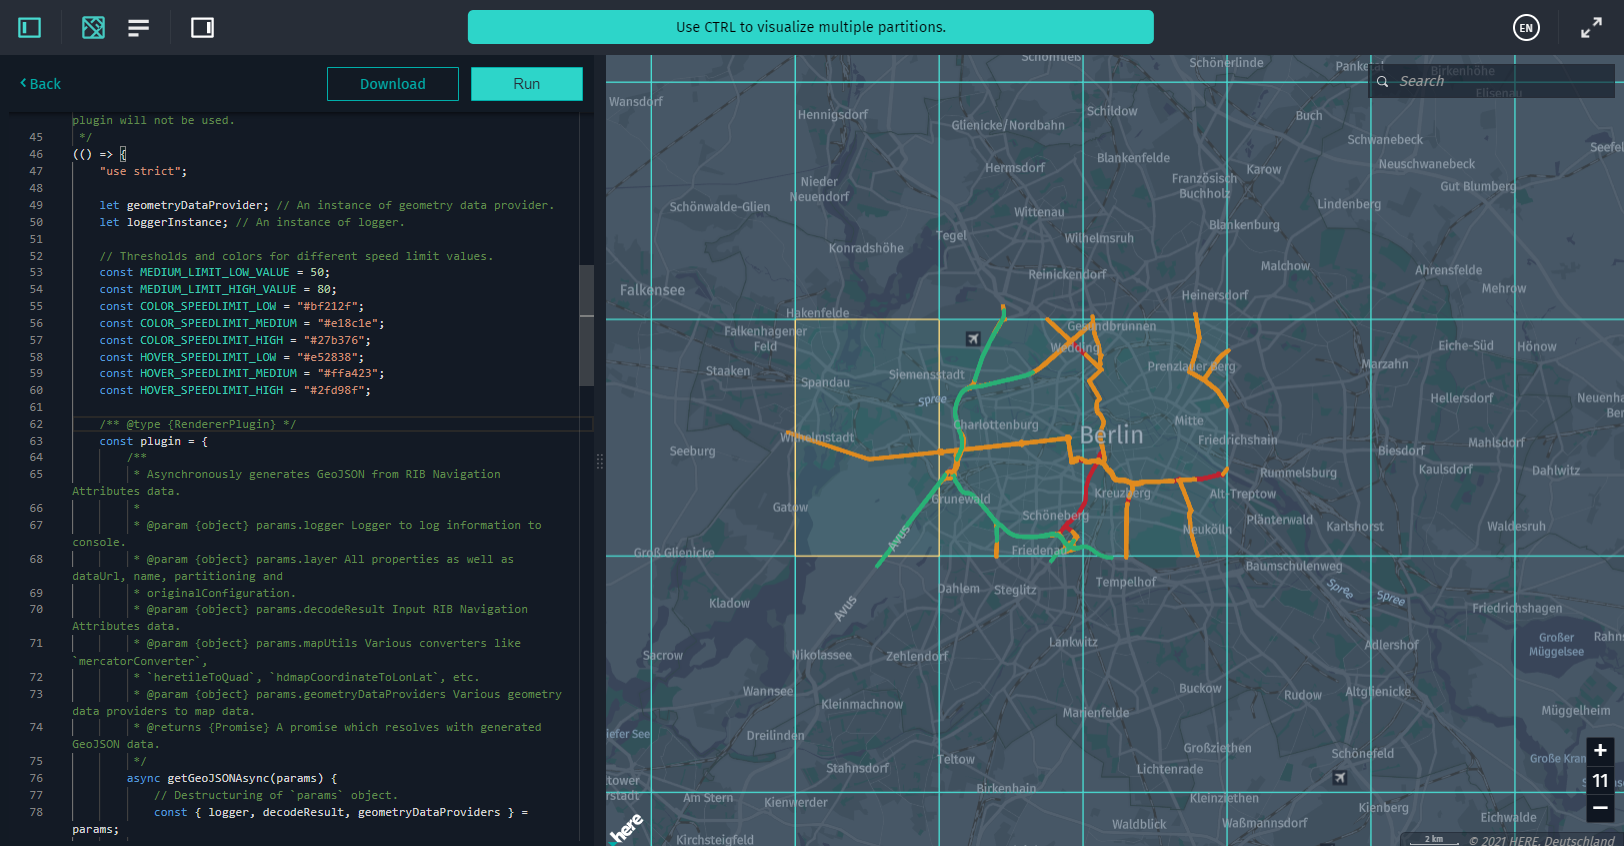
-
VersionPicker: A widget used by theDataInspectorclass to choose the version of the catalog currently displayed in theDataInspector's data source. This class has a set of UI widgets for showing the current catalog's version in theDataInspector'sToolBarclass and a modal dialog box that enlists all the catalog's versions.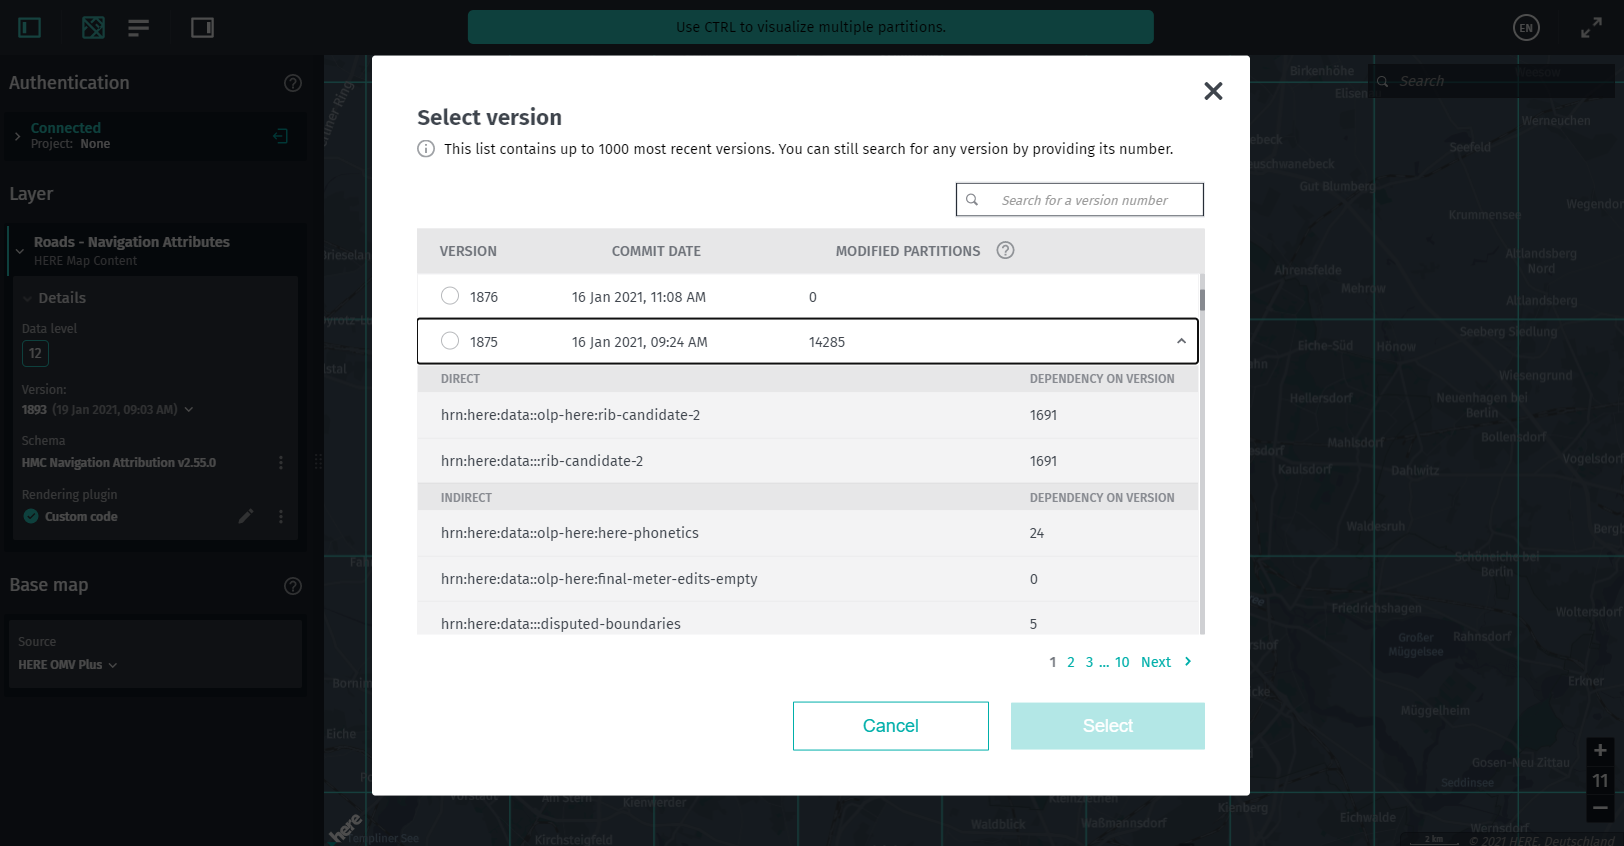
-
TileMenu: A context menu for a tile that allows copying the ID of the currently selected partition inMapView, decode partition data, view and copy the geocoordinates of the currently selected location on the map. Also, for a selected partition, this menu allows downloading raw data, data decoded with the linked Protobuf schema, and GeoJSON data translated with the rendering plugin.You should create an instance of
TileMenuonly once and further operate via theTileMenu.setStatemethod.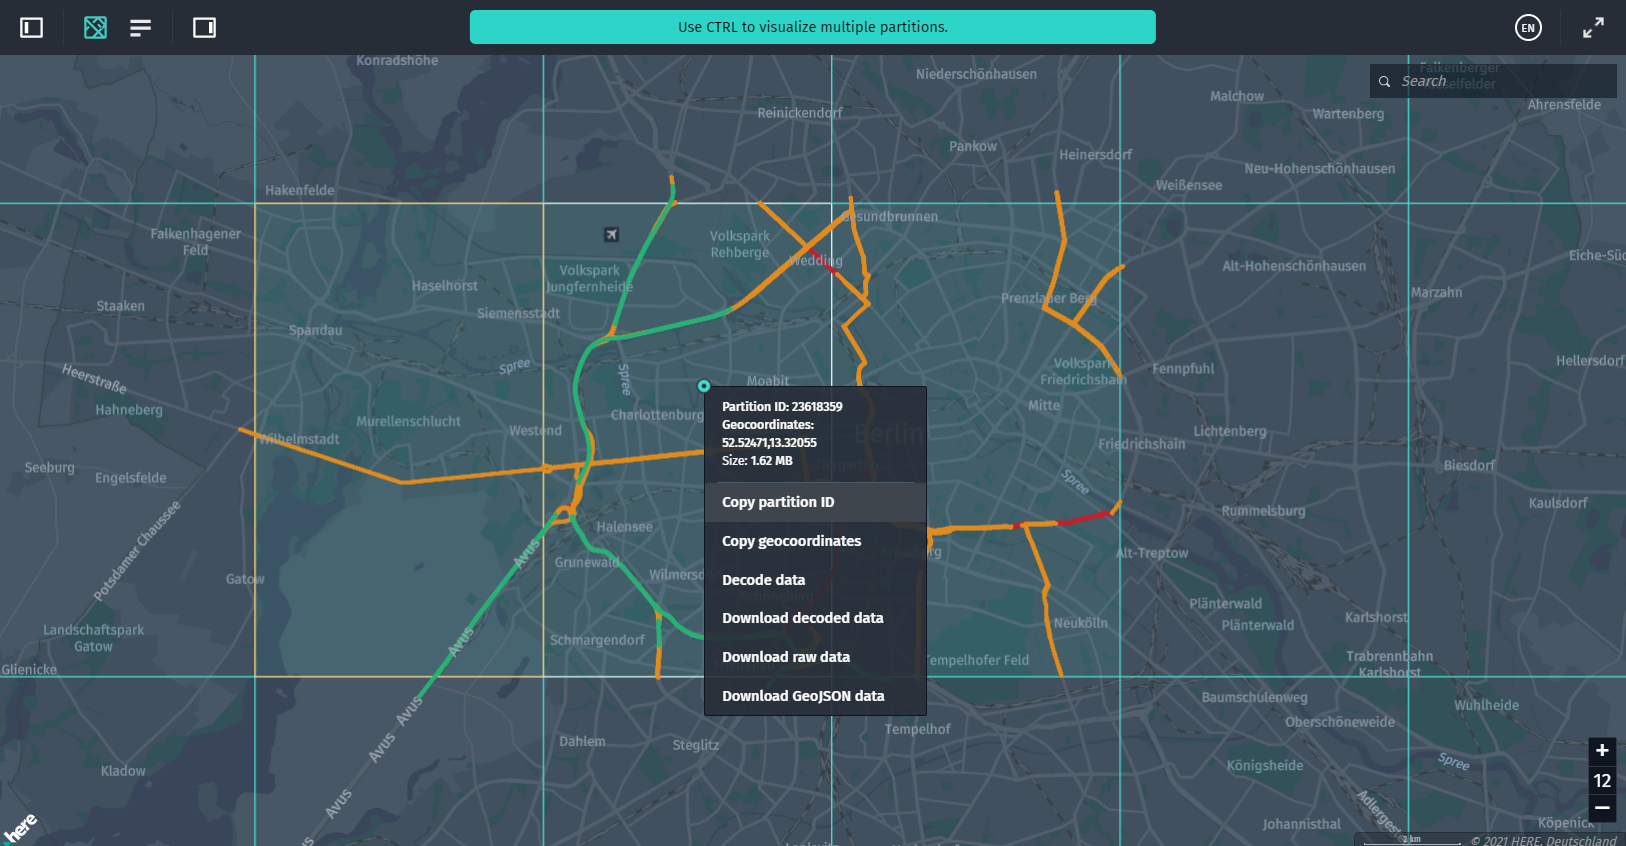
-
StatusBar: A UI widget that allows showing various status messages to users. This component is automatically created by theDataInspectorbut can also be used without it.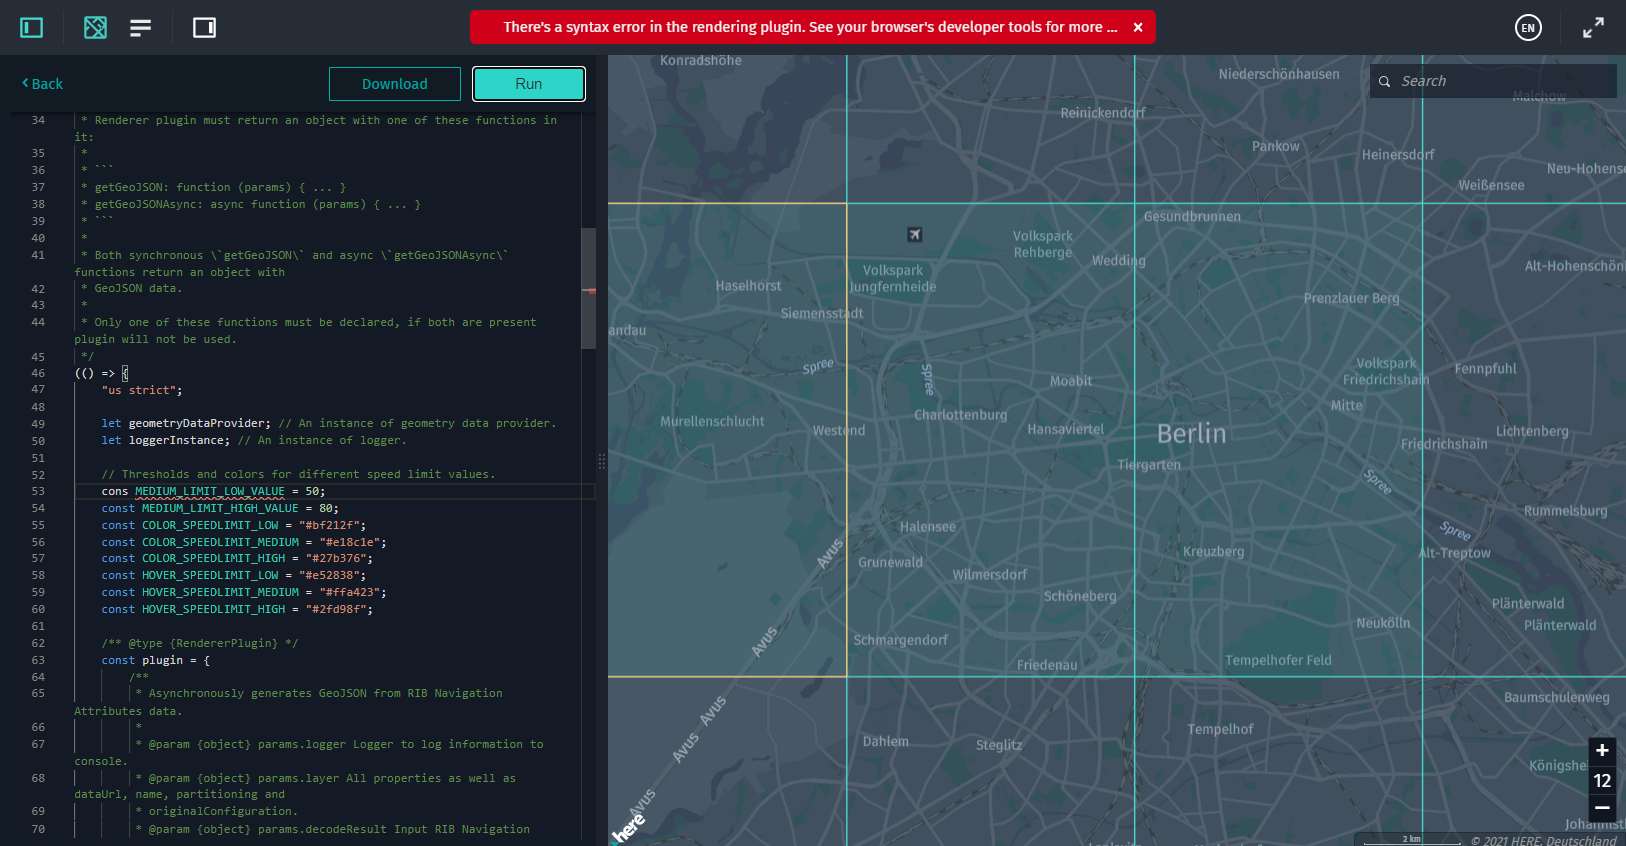
-
SdiiControls: A set of control widgets for@here/sdii-datasourcethat allow for SDII features filtering: switching on/off paths, different types of road signs, or other events. -
RibControls: A set of control widgets for@here/rib-datasourcethat allow for HERE Map Content Data features filtering: switching on/off segments, nodes from the Topology layer, different categories of objects from the Roads - Topology & Geometry and Building Footprints layers. -
CoverageControls: A UI widget that contains controls for adjusting the appearance of a data size heat map.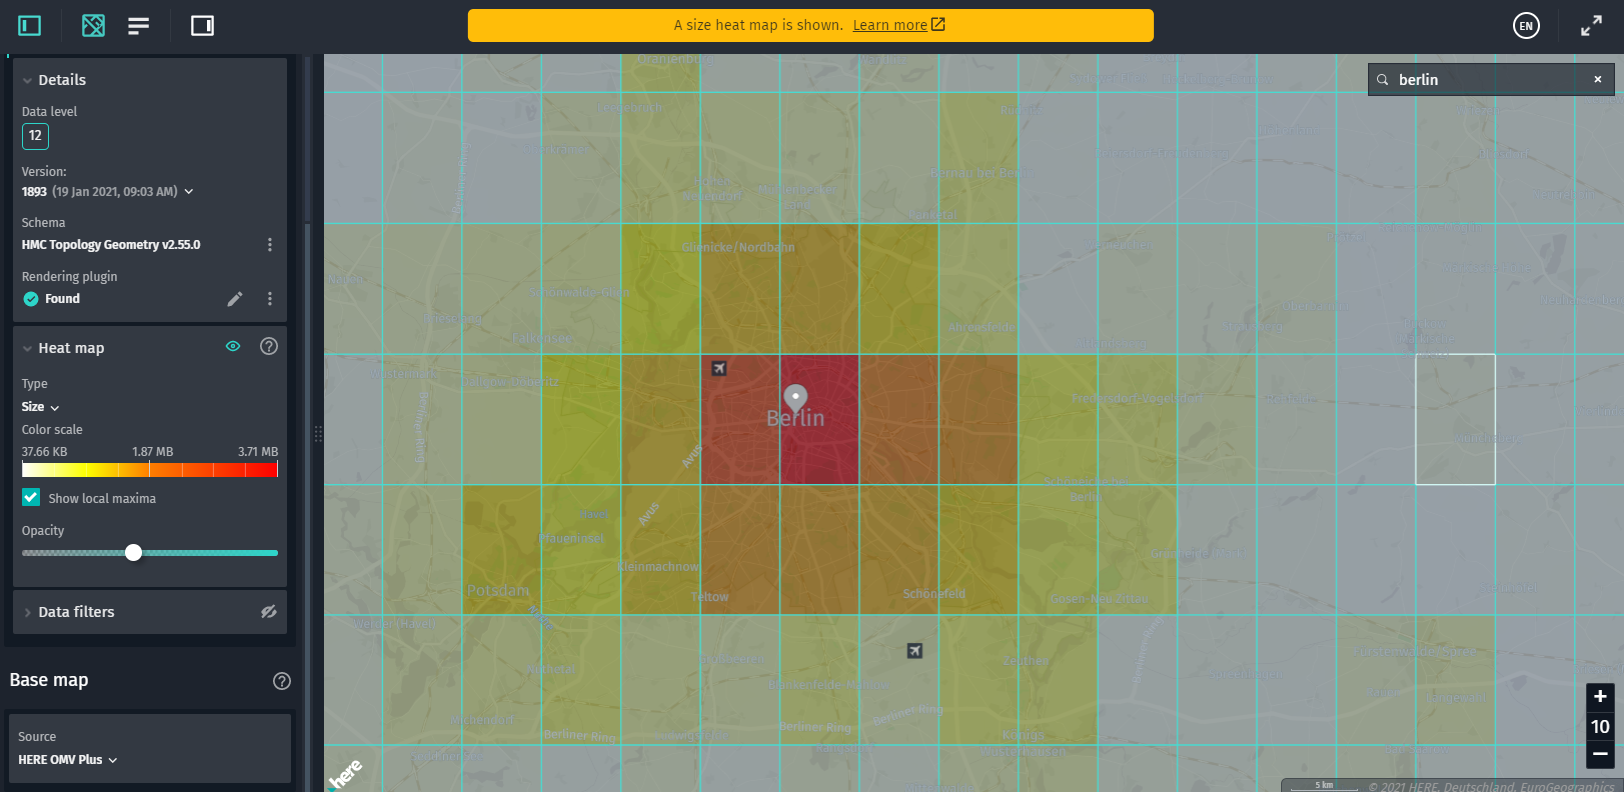
-
MapControlHandler: A class that enables interaction with theMapViewusing mouse or touch events. -
TileControlHandler: A class that provides tile-selection and mouse-hover functionality for theInteractiveDataSourceandCoverageDataSource. This component also allows controlling the context menu displayed by right-clicking a tile.TileControlHandleris automatically created by theDataInspectorbut can be also used without it. -
SearchComponent: A UI widget that is used to search for a partition ID, specific geographical coordinates (lat/long), locations, and places. Also, this component provides the history of recent searches. It is enabled by default.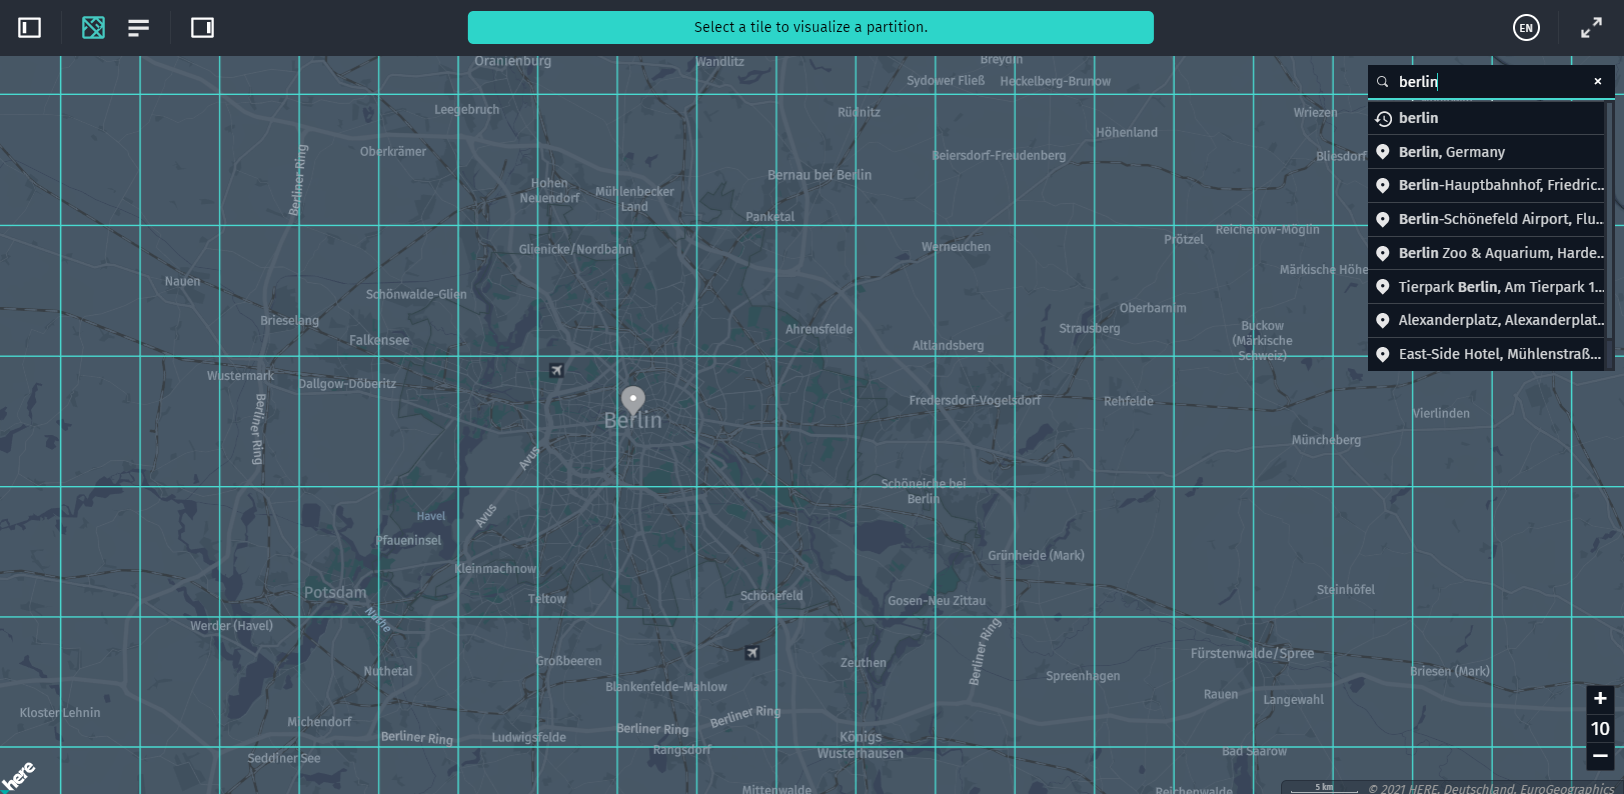
-
@here/fileupload: A UI file upload field with a button for the@here/olp-geojson-datasourcecomponent that you can use to upload GeoJSON files. This data is then immediately rendered by the@here/olp-geojson-datasource.
Data sources
@here/olp-geojson-datasource: A data source that renders GeoJSON data on top of the base map.@here/sdii-datasource: A data source that renders SDII data on top of the base map.@here/coverage-datasource: A special descriptive data source that gives you an insight into the geographic coverage of the data that you load. The coverage is rendered as a tile grid that is overlaid on top of the base map.@here/rib-datasource: A data source that renders highly accurate geo-referenced data from catalogs that use the HERE Map Content schema.
External dependencies for data sources
three.js: A cross-browser JavaScript library for WebGLprotobufjs: A protobuf parser for JavaScriptearcut: A polygon triangulation library
A full list of dependencies can be found in the External Dependencies chapter.
Utility components
@here/interactive-datasource-protocol: This component provides an abstract base class that you can use to start developing your own data sources that support features, raycasting, and more.
Any custom data source should extend the InteractiveDataSource class and support the following actions:
-
Select and deselect tiles.
-
Select and highlight features.
-
Render multiple tiles of
levelWithDataon multiple zoom levels (via a composed tile feature). -
Perform raycasting with
InteractiveIntersectionAgentincluding mouse-over and click functionality for each feature. -
@here/geometry-data-provider: Because some data has no geometry information in it, but can be mapped to other geometry, this component provides geometry to visualize the types of data that relies on it.This component contains classes for providing road geometry that can be used for visualizing such data as traffic and speed limits.
-
@here/generator-visualization-app: Generates a sample web app with a set of custom-defined Data Inspector Library components. Use it to create your own base application and to develop a custom data source.
Updated 2 days ago