Compact overlay encoding
This overlay encoding format is a more compact equivalent of the GeoJSON format while supporting the same geometry types and style properties to produce the same output.
Explore the HERE Map Image API v3 with this interactive example. Test parameters and see real-time results:
Try It OutWith specific representations for Point, Line, and Polygon geometries, compact overlay encoding ensures a seamless mapping experience. This format is especially useful when:
- The request size while using the GeoJSON format is too large.
- You prefer simplicity.
- Your mapping app lacks native GeoJSON support.
To further reduce the request size, this overlay encoding style utilizes shared property and flexible polyline formats to further reduce the overall request size, as compared to GeoJSON. This optimization is particularly valuable when dealing with data transmission in bandwidth-constrained environments, applications with strict size limitations, or requests that might contain multiple complex geometries.
The following sections provide an overview of the custom overlay encoding syntax, available geometry types, and examples, highlighting its simplicity for efficient data visualization.
Format specification
The custom encoding format provides a specific and structured way to define styles and properties for various overlay features and follows this syntax:
overlay={geometry_type}:{geometry};{property_1}={value_1};{property_2}={value_2};...
Consider the following example:
overlay=point:51.50995,-0.134496;label=A;size=large
In this example:
pointrepresents the geometry type.51.50995,-0.134496are the{latitude},{longitude}geometry coordinates.label:Aandsize:largeareproperty=valuepairs, separated by the;character and defining additional properties for the style.
Note
- You can specify multiple
overlayparameter instances within a single request, for example:
overlay=point:-13.2223,53.0123;label=A&overlay=point:-13.2233,53.0153;label=B- You can specify multiple geometries of any single type within an overlay parameter, for example:
overlay=point:-13.2223,53.0123;label=A|-13.2233,53.0153;label=B
Available geometry types
You can use the following geometry types with the custom overlay encoding:
point and multiPoint geometries
point and multiPoint geometriesThe point and multiPoint geometries can be visually represented as markers or circles on a map. These geometries allow you to pinpoint specific locations or plot multiple points at once.
To define a point, you provide a {latitude},{longitude} pair, for example:
51.50995,-0.134496
For multiPoint, use a comma-separated list of point entries, where each pair of coordinates represents a specific point, for example:
52.532018,13.394813,52.531459,13.388488
point and multiPoint geometries as markers
point and multiPoint geometries as markersThe marker style allows you to customize the appearance of markers placed at the given coordinates. For detailed information on the style properties available for markers, refer to the corresponding section in the GeoJSON format documentation.
Example: point (marker)
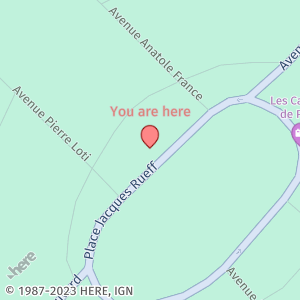
point (marker)In this example, the overlay parameter creates a pin marker with a custom label and color properties:
overlay=point:48.856246,2.297585;label=You are here;text-color=#FF000080The following map image displays a marker rendered with the style parameters from the preceding example:
Note
Consider the following constraints for
labeldefinition as part of the compact overlay encoding:
Because the
;(semicolon) and|(pipe) characters have special meanings, including them in labels might cause errors or produce unexpected results. However, you can escape such characters with the\(backslash) character, for example:
overlay=point:-13.2223,53.0123;label=My\|LabelThere are four characters where escape is supported:
\nfor a new line,\;for a semicolon,\|for a pipe, and\\for a single backslash. Examples include:
overlay=point:-13.2223,53.0123;label=My\|Label
overlay=point:-13.2223,53.0123;label=My\;Label
overlay=point:-13.2223,53.0123;label=My\nLabel
overlay=point:-13.2223,53.0123;label=My\\Label
Example: multiPoint (marker)
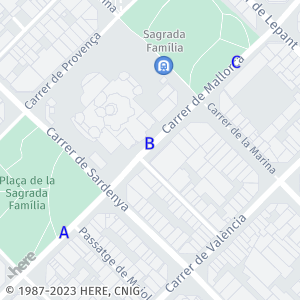
multiPoint (marker)In this example, the overlay parameter creates multiple markers with automatic labels and custom color and size properties:
overlay=multiPoint:41.402215,2.173716,41.403145,2.174910,41.403997,2.176115;label=$alpha;icon="";size=large;text-color=%2300FThe following map image shows multiple markers rendered with the style parameters from the preceding example:
point and multiPoint geometries as circles
point and multiPoint geometries as circlesIn addition to markers, you can represent Point and MultiPoint geometries as circles on the map. For detailed information on the style properties available for circles, refer to the corresponding section in the GeoJSON format documentation.
Example: point (circle)
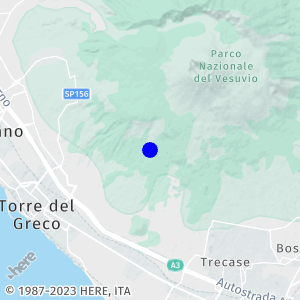
point (circle)In this example, the custom overlay encoding parameter requests a single circle marker with a custom color, width, outline-color, and outline-width:
overlay=point:40.800776,14.408616;style=circle;color=#0000FF;width=12;outline-color=%230000FF;outline-width=2pxThe following map image displays a circle marker rendered with the style parameters from the preceding example:
Example: multiPoint (circle)
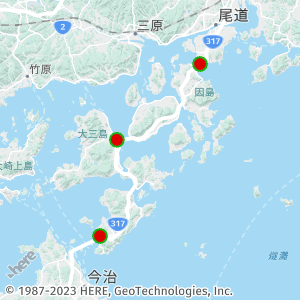
multiPoint (circle)In this example, the custom overlay encoding parameter requests multiple circle markers with a custom color, width, outline color, and outline width:
overlay=multiPoint:34.358009,133.180546,34.258753,133.048710,34.132670,133.021931;style=circle;color=#DD0000;width=12;outline-color=#1CB31C;outline-width=2The map image shows multiple circle markers rendered with the style parameters from the preceding example:
line and multiLine geometries
line and multiLine geometriesThe line style allows you to create visually appealing lines between specified points and customize various properties to suit your needs. For detailed information on the style properties available for lines and multi-lines, refer to the corresponding section in the GeoJSON format documentation.
To define a line geometry, you specify a series of coordinates, in the form of {latitude1},{longitude1},{latitude2},{longitude2}, ... ,{latitudeN},{longitudeN} that comprise a line.
To define a multiLine, you follow the format for the line geometry and then separate each line with the ; character.
Example: line
lineIn this example, the line parameter creates a line between two points with a custom color, width, outline color, and outline width:
overlay=line:37.798557,-122.407653,37.802443,-122.413291;color=%23DD0000;width=7;outline-color=#00DD00;outline-width=5ydThe following map image displays a line rendered with style parameters from the preceding example:
Example: multiLine
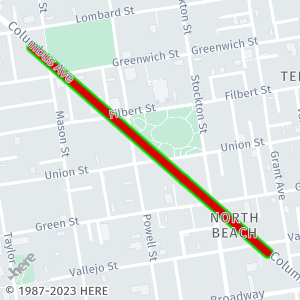
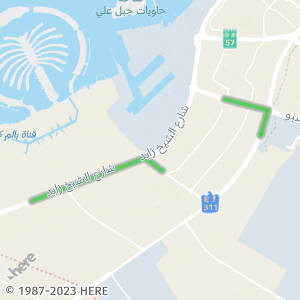
multiLineIn this example, the multiLine parameter creates multiple lines that are not connected to each other:
overlay=multiLine:24.981590,55.114103,24.975055,55.142256,24.960115,55.137449;24.939259,55.073248,24.946731,55.061918,24.921364,54.988240;color=#00DD0080;width=4px;outline-color=#B9BABC;outline-width=2The map image shows a multiLine rendered with style parameters from the preceding example:
By utilizing these line style properties, you can create visually striking and informative lines or multi-lines to represent your data on the map.
polygon and multiPolygon geometries
polygon and multiPolygon geometriesWith the polygon and multiPolygon geometry types, you can represent a wide range of shapes and areas, from simple single polygons to complex structures comprising multiple polygons grouped together.
A polygon is represented as a semicolon-separated list of line objects, where each line must contain at least three points In the custom overlay encoding, you do not need to ensure that the first and last points in polygon coordinates have the same value (in contrast to the GeoJSON format), as the API automatically computes the final line in case the final point does not have the same coordinates as the first point, for example:
29.980179,31.133038,29.978143,31.133038,29.978124,31.135421,29.980197,31.135421
Note
As shown in the preceding example, a polygon geometry can also consist of a single line only.
A multiPolygon is represented as a list of polygon objects, with each polygon separated by ;; characters, for example:
52.532018,13.394813,52.531459,13.388488,52.731459,13.3288488,52.532018,13.394813;;52.532018,13.394813,52.531459,13.388488,52.731459,13.3288488,52.532018,13.394813
For a comprehensive list of style properties available for polygon and multiPolygon, refer to the corresponding section in the GeoJSON format documentation.
Example: polygon
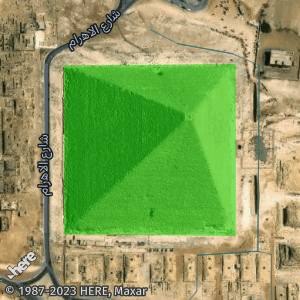
polygonTo draw a single polygon at specific coordinates, use the overlay parameter as demonstrated in the following example:
overlay=polygon:29.980179,31.133038,29.978143,31.133038,29.978124,31.135421,29.980197,31.135421;color=#00DD0080Note
The coordinates for the last point do not match the coordinates for the initial point for the polygon.
The following map image illustrates the rendered polygon with the specified style parameters:
Example: multiPolygon
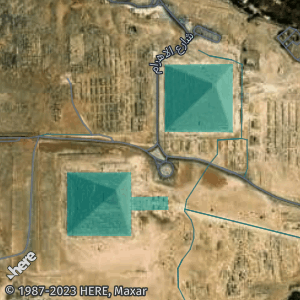
To draw multiple polygons at specified coordinates, use the overlay parameter as demonstrated in the following example:
overlay=multiPolygon:29.980179,31.133038,29.978143,31.133038,29.978124,31.135421,29.980197,31.135421,29.980179,31.133038;;29.976913,31.129631,29.974997,31.129635,29.974989,31.131875,29.975757,31.131867,29.975779,31.133173,29.976186,31.133151,29.976172,31.131877,29.976916,31.131864,29.976913,31.129631;color=#08AAAA80The map image below illustrates the rendered multiPolygon with the specified style parameters:
Style specification for custom overlay encoding
You can specify various properties for each geometry within the same overlay parameter while still having the option to apply shared properties to multiple geometries at the same time.
Geometry-specific style properties
The format for specifying specific properties for each specific geometry type within a single overlay parameter follows this specification:
overlay={geometry_type}:{geometry1};{properties1}|{geometry2}|{properties2}|...{geometryN};{propertiesN}
For example, consider the following overlay parameter value:
overlay=point:55.230153,-6.511510;label=Point A|55.233660,-6.520295;label=Point BIn this example, each point has a specific label:
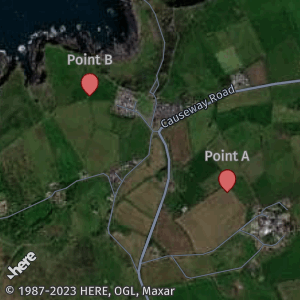
Shared style properties
You can specify properties that apply to multiple geometries, in addition to geometry-specific properties within a single overlay parameter. The specification follows this format:
overlay={geometryType}:({geometry1};{properties1}|{geometry2};{properties2} ...|{geometryN};{propertiesN}|{shared_properties}
In this format, each geometry with the corresponding properties is separated by the | character. The properties defined after the rightmost | separator apply to all preceding geometries.
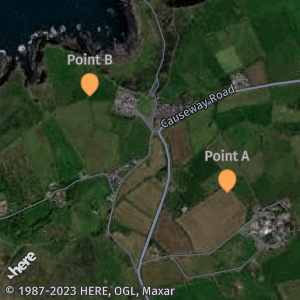
overlay=point:44.427762,-110.588240;label=A|44.430349,-110.599134;label=B|44.424543,-110.596847;label=C|color=#FEA857;outline-color=#D48C49In the preceding example, each geometry has a distinct label with marker color and outline-color properties applied to all geometries.
The following image illustrates the overlay configuration from the preceding example:
Note
Consider the following design features and restrictions:
- When there is a conflict between a geometry-specific property value and the value set for all geometries within
overlay, the geometry-specific value takes precedence.- You cannot define a property value for a single geometry more than once.
Flexible polyline encoding
The flexible polyline is a method for encoding coordinates and lists of coordinates with a compact representation. You can use a flexible polyline in place of traditional geometry encoding for multiPoint and line geometries. The multiLine is represented by multiple semicolon-separated flexible polylines, for example, flexible_polyline1;flexible_polyline2;flexible_polyline3.
To represent geometry coordinates using flexible polylines, follow this specification:
overlay={geometry_type}:{flexible-polyline};{style_properties}
Example: Flexible polyline
Consider an example of a multiLine object represented in the custom overlay encoding:
line:50.10228,8.69821,50.10201,8.69567,50.10063,8.69150,50.09878,8.68752;color=#0F0The same parameter value can be represented as a flexible polyline:
line:BFoz5xJ67i1B1B7PzIhaxL7Y;color=#0F0As demonstrated in the preceding example, the flexible polyline provides a valuable option for applications requiring geometry encoding with reduced data size. Also, you can style geometries represented as flexible polylines similarly to traditional geometry encoding.
For a practical demonstration of how to use flexible polyline to compress large GeoJSON objects, see Handle requests with complex overlay data.
Note
You can mix different geometry representations within a single style parameter, for example:
overlay=line:BFul98Ii8y3D2H1nI|46.686867,19.595674,46.663263,19.564183overlay=multiLine:BFul98Ii8y3D2H1nI;46.686867,19.595674,46.663263,19.564183
Next steps
For instructions on how add layers of information by using the custom overlay encoding format, see Add layers of information by using compact overlay encoding.