Add layers of information by using compact overlay encoding
To enhance the level of detail and customization in your maps, you can use GeoJSON geometries in the custom overlay encoding format to add more layers of information to your map images. This custom encoding format allows you to define and display geographic features such as points, lines, and polygons, together with associated style attributes.
In this tutorial, the objective is to learn how to set a custom overlay for a sample tourist map, showcasing different landmarks. The tutorial explores the process of creating a visually appealing and informative map overlay by incorporating various geometric shapes and features, including lines representing routes, points marking landmark locations, and polygons outlining regions of interest.
Before you begin
Understand the format, behavior, and the specification for custom overlay style in HERE Map Image API. For more information, see Compact overlay encoding.
Display markers
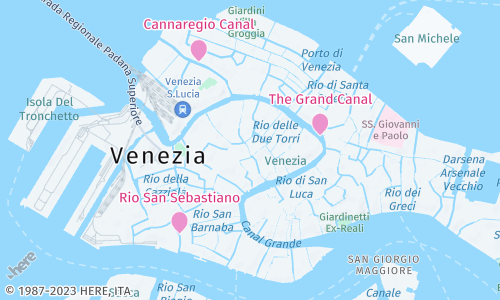
You can display markers with labels on a map to represent various points of interest, such as landmarks, tourist attractions, and restaurants. Markers are a helpful way to make your maps more informative and visually appealing.
To create multiple markers with custom attributes, you can use the following parameter format:
overlay=point:45.439341,12.335684;label=The Grand Canal|45.444909,12.322617;label=Cannaregio Canal|45.431918,12.320548;label=Rio San Sebastiano|text-color=#D61A6E;text-outline-color=#FFF;outline-width=2;color=#EC93CE;outline-color=#FFF
where:
label- Specifies the label or text that appears above the marker.color- Sets the color of the marker.text-color- Sets the label color.text-outline-color- Sets the color for the label outline.outline-color- Determines the color of the marker outline.outline-width- Adjusts the width of the label outline.latitudeandlongitudecoordinates - Represents the geographic coordinates (latitude and longitude) of the marker's location.
Sample request #1:
Consider the following request:
https://image.maps.hereapi.com/mia/v3/base/mc/overlay:zoom=14;padding=64/500x300/png8
?apikey={YOUR_API_KEY}
&features=pois:disabled
&overlay=point:45.439341,12.335684;label=The Grand Canal|45.444909,12.322617;label=Cannaregio Canal|45.431918,12.320548;label=Rio San Sebastiano|text-color=%23D61A6E;text-outline-color=%23FFF;outline-width=2;color=%23EC93CE;outline-color=%23FFFResponse:
The API generates a map image with labelled pin markers at the specified coordinates, as shown in the preceding example.
Display lines
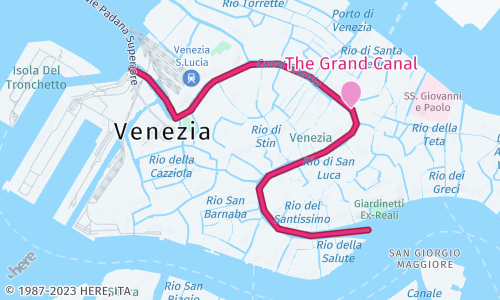
To create a custom line representation on a map, you can use the line parameter in an API request. This parameter allows you to define various properties of the line, such as its color, width, and outline settings.
To create a line with custom attributes, use the overlay=line or overlay=multiLine parameter format, for example:
overlay=line:BFktr1IgrlrC5DsJ7IqKzH6FmDuIoJ0JyC8D-GwVGqQtFsSjN-X5F0CzDxCzHrP5J_gBnFzF7I-CtHoI7CkTuC-gB;color=#E82D89;width=30m
This sample parameters creates a line representing a canal's length. The line is drawn with a custom color (#E82D89) and the width of 30 meters:
Sample request #2
https://image.maps.hereapi.com/mia/v3/base/mc/overlay:zoom=14;padding=64/500x300/png8
?apikey={YOUR_API_KEY}
&features=pois:disabled
&overlay=line:BFktr1IgrlrC5DsJ7IqKzH6FmDuIoJ0JyC8D-GwVGqQtFsSjN-X5F0CzDxCzHrP5J_gBnFzF7I-CtHoI7CkTuC-gB;color=%23E82D89;width=30m
&overlay=point:45.439341,12.335684;size=large;label=The Grand Canal;text-color=%23D61A6E;text-outline-color=%23fff;outline-width=2;color=%23EC93CE;outline-color=%23FFFNote
The preceding example uses a complex
Linegeometry that is encoded as a flexible polyline to significantly reduce the request size.
Response:
The map image displays a line, as specified in the preceding example:
Display polygons
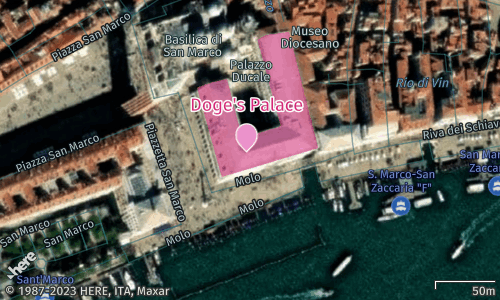
Polygons typically represent specific areas on a map, allowing you to highlight boundaries, regions, or areas of interest associated with your data.
To create custom polygon representations on a map, use the overlay=polygon or overlay=multiPolygon parameters in an API request. These parameters allow you to define the polygon color and provide a series of latitude and longitude coordinates that define the vertices of the polygon.
Sample request #3
This example creates a polygon that highlights a landmark in Venice. The polygon is drawn with a custom color (#E82D8980) and its shape is defined by a series of latitude and longitude coordinates.
https://image.maps.hereapi.com/mia/v3/base/mc/center:45.433761,12.340388;zoom=17/500x300/png8
?apikey={YOUR_API_KEY}
&features=pois:disabled
&scaleBar=km
&style=explore.satellite.day
&overlay=polygon:45.434594,12.340467,45.433939,12.340717,45.433852,12.340304,45.434297,12.340141,45.434267,12.339968,45.434231,12.339819,45.433558,12.340085,45.433776,12.341120,45.434651,12.340805,45.434627,12.340570,45.434594,12.340467;color=%23E82D8980
&overlay=point:45.433731,12.340354;size=large;label=Doge's Palace;text-color=%23D61A6E;text-outline-color=%23FFF;outline-width=2;color=%23EC93CE;outline-color=%23FFFResponse:
The map image now displays the polygon, highlighting a particular map area:
Next steps
- To explore all supported endpoints and parameters, see the API Reference.
- To gain more hands-on experience with the HERE Map Image API see the
Tutorialssection of this guide.