Visualize terrain data in 3D with HERE DEM
The HERE Digital Elevation Model (DEM) provides a detailed dataset containing color-coded terrain elevation information, essential in use cases where creating accurate and engaging 3D maps is important. This tutorial guides you through the process of loading and processing the DEM data from HERE by using the MapLibre library for mapping and visualization. By combining the capabilities of MapLibre and the HERE DEM dataset, you can create interactive 3D maps that showcase complex terrain features with precision and accuracy.
Prerequisites
Understand the dem style which is the source of the elevation data for 3D maps. For more information, see Styles.
Set up the map container
To begin creating your 3D map with HERE DEM data, start by setting up a basic map container in your HTML file.
<!DOCTYPE html>
<html lang="en">
<head>
    <title>3D Terrain Map with HERE DEM</title>
    <meta charset='utf-8'>
    <meta name="viewport" content="width=device-width, initial-scale=1">

    <!-- MapLibre GL CSS for 3D map rendering -->
    <link rel='stylesheet' href='https://unpkg.com/[email protected]/dist/maplibre-gl.css' />

    <!-- MapLibre GL JS library -->
    <script src='https://unpkg.com/[email protected]/dist/maplibre-gl.js'></script>
    <style>

        /* Remove margins and padding to make the map full screen */
        body { margin: 0; padding: 0; }

        /* Ensure the map container takes up the full viewport */
        html, body, #map { height: 100%; }
    </style>
</head>
<body>

<!-- Map container -->
<div id="map"></div>

<!-- Your JS file with map initialization and configuration -->
<script src="demo.js"></script>
</body>
</html>
Create the 3D map base
Now that you have your map container set up, load and render your HERE DEM data using the MapLibre library through a JavaScript file. The following code sample creates a base map by combining three layers: the base raster layer, the hillshade layer, and the DEM layer, each rendered separately to maximize the display quality.
// Instantiate your HERE API key
// Replace the placeholder value with a valid HERE API key
const apiKey = "YOUR_HERE_API_KEY"
const map = (window.map = new maplibregl.Map({
    container: 'map',
    zoom: 11,
    center: [10.8855,45.9122],
    // Set the initial pitch angle to give a tilted 3D view
    pitch: 45,
    // Enable hash-based navigation (adds coordinates and zoom to URL)
    hash: true,
    // Define the map style and data sources
    style: {
        version: 8,
        sources: {
            // HERE base raster tile source
            rasterTileApi: {
                type: 'raster',
                // This request template renders the map in the explore.day style
                tiles:
                      [`https://maps.hereapi.com/v3/base/mc/{z}/{x}/{y}/png?size=256&style=explore.day&apiKey=${apiKey}`],
                tileSize: 256,
                attribution: "© 2025 HERE",
                maxzoom: 14,
                minzoom:1
            },
            // HERE terrain data source for elevation and 3D effects
            terrainSource: {
                type: 'raster-dem',
                tiles:
                    [`https://maps.hereapi.com/v3/base/mc/{z}/{x}/{y}/png?size=256&style=dem&apiKey=${apiKey}`],
                tileSize: 256,
                attribution: "© 2025 HERE",
                maxzoom: 14,
                minzoom:1
            },
            // HERE hillshade data source to add shading effects
            hillshadeSource: {
                type: 'raster-dem',
                tiles:
                    [`https://maps.hereapi.com/v3/base/mc/{z}/{x}/{y}/png?size=256&style=dem&apiKey=${apiKey}`],
                tileSize: 256,
                attribution: "© 2025 HERE",
                maxzoom: 14,
                minzoom:1
            }
        },
        // Define the map layers
        layers: [
            {
                id: 'cartography',
                type: 'raster',
                source: 'rasterTileApi'
            },
            {
                id: 'hills',
                type: 'hillshade',
                source: 'hillshadeSource',
                layout: {visibility: 'visible'}
            }
        ],
        // Set terrain configuration to use the terrain source
        terrain: {
            source: 'terrainSource'
        },
        // Enable the sky layer for a natural sky effect
        sky: {}
    },
    // Set maximum zoom level to limit how close you can get
    maxZoom: 14,
    // Set the maximum pitch angle (tilt)
    maxPitch: 85
}));
// Add navigation controls (zoom and compass) to the map
map.addControl(
    new maplibregl.NavigationControl({
        visualizePitch: true,
        showZoom: true,
        showCompass: true
    })
);
// Add terrain control to allow toggling terrain on and off
map.addControl(
    new maplibregl.TerrainControl({
        source: 'terrainSource'
    })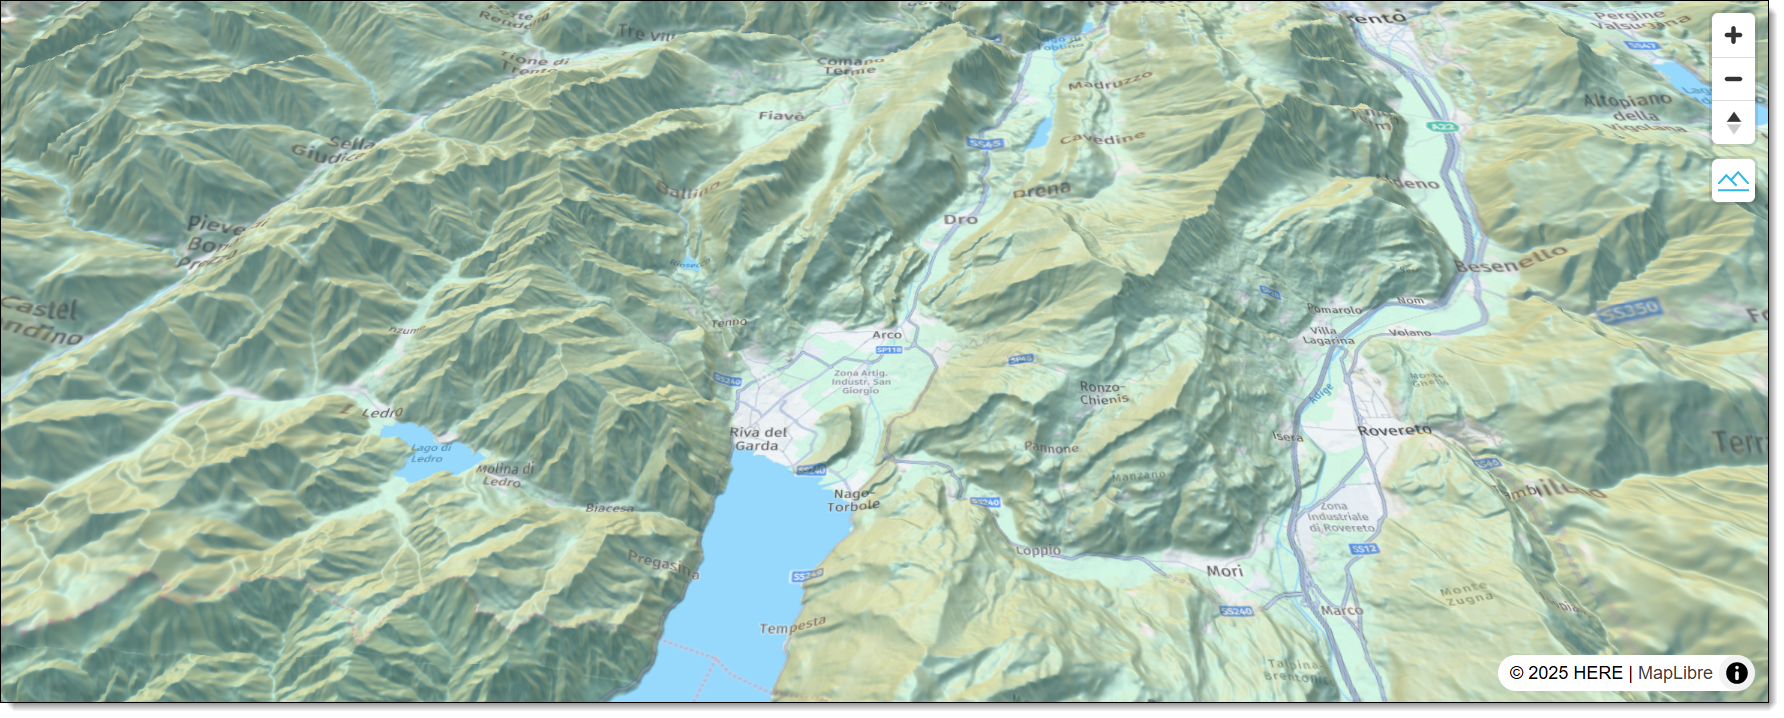
);Result:
After opening the HTML file in the browser of your choice, the browser window displays the following 3D map:
Next steps
For more information, see the API Reference.